Analyzing December HVAC Demand Trends
👋 Hey, Jon here for the second time this week :) There are SO many new names on the subscriber list, I’m humbled by you all joining me here and will always strive to bring you as much value as possible with data insights from our platform.
If you have any requests for data topics or insights you want covered in future newsletters, I’m eager to hear your feedback. Just drop me an e-mail at Jon@SearchLightDigital.io.
December, and 2022, are behind us, so it’s time to look at a monthly trends report from a sample of anonymized HVAC contractors across the US (PPC + Facebook ad data).
In the final section of this newsletter, I introduce a new concept for thinking about KPIs and how you can use them to predict demand and take decisive action sooner if performance is on a downward trend.
Average Tickets Continued to Decline
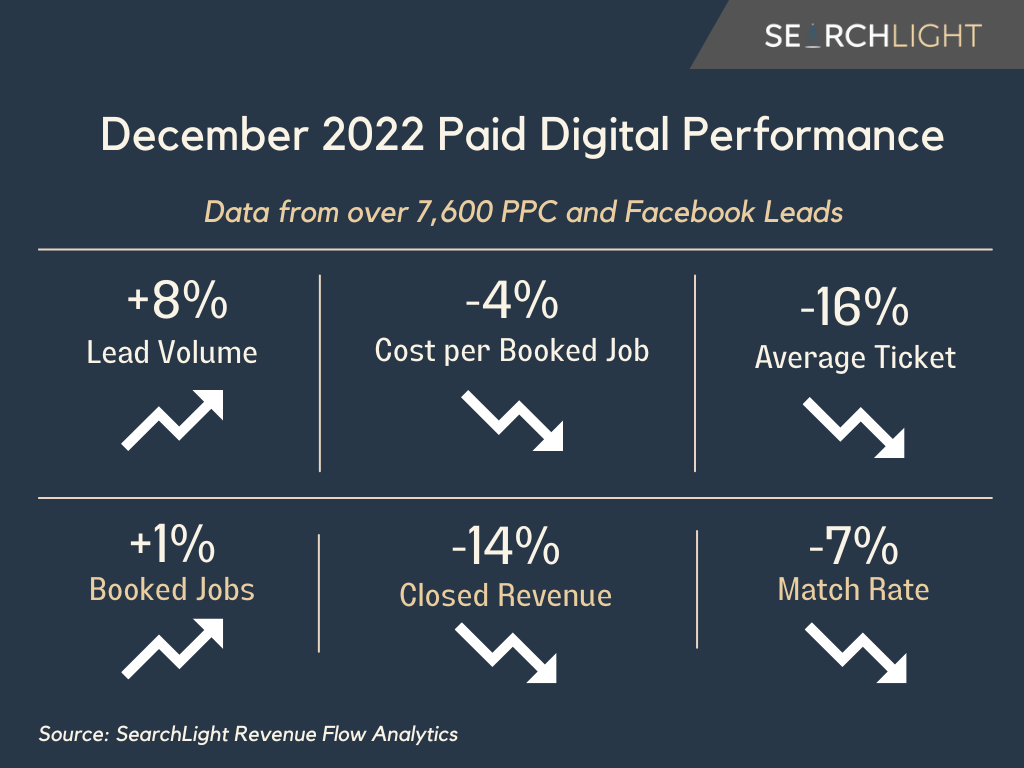
December showed some improvements from November, and was another short month with holidays, but what stands out to me is that average tickets dropped by 16% for the second month in a row:
Average Ticket: ⬇️ 16%
The number of installation customers dropped 10.5% from November to December and the average ticket of those customers dropped by 10%.
Keep in mind, the booked job rate for installs was up 2% from November to December, so it’s clear that there was less demand in December than November.
We can speculate why that is - weather, capacity, macroeconomy, less organic demand (which I’ve been predicting for 2023/24), lead handling, discounting, or a mix of each - but it’s a key insight into understanding the rest of the performance for the month.
December Closed Revenue Declined 14% Despite Higher Lead Volume
Lead volumes were up 8% just as they were in November (up 10%), the cost per booked job dropped by 4% and booked jobs were up 1%:
Lead Volume: ⬆️ 8%
Cost per Booked Job: ⬇️ 4%
Booked Jobs: ⬆️ 1%
These are all indicators of improved performance and the expectation of more closed revenue, but they weren’t enough to overcome the decline in average tickets and fewer installs.
Despite some positive trends, closed revenue was down, although not as much as it was in November (18.8%):
Closed Revenue: ⬇️ - 14%
We did see a cold snap across the US toward the end of December, which greatly impacted demand and it’s possible that some of the leads originated during that time will replace their equipment in the New Year.
Using Leading Indicators to Predict January Performance
When looking for insights that lead to better decisions, I break KPIs down into two categories:
(1) Leading Indicators - something that predicts what might happen in the future (e.g. sold jobs that aren’t yet complete, high lead volume early in the week or month, an upcoming snowstorm and low temperatures in the forecast)
(2) Lagging Indicators - something that tells you what already happened (e.g. closed revenue, average tickets)
Closed revenue and average tickets won’t tell us what might happen next month, but there are KPIs that can give us a clue into future performance.
And the one I look at the most is sold jobs (you could also look at booked sales consultations).
In a given month, we measure revenue that closed and completed within that time frame, but we also look at jobs that were sold but not yet completed in that time frame.
This tells us how much revenue was already sold and will occur in the future (hence why it is a leading indicator).
Sold revenue was down 22.5% from November to December (it was down 30% from October to November, and November’s closed revenue dropped 18.8%), so with the current data, I’d predict closed revenue will again decline, but not as much as it did from November to December.
We can also look at leading indicators like lead volume (up 25% in the first few days of January) and estimates (up 17%, although only a small sample from the first 4 days of the month) to begin to understand what the rest of the month might look like.
A prediction is what we think will happen, not what will happen, but you can use leading indicators to take decisive action (even if it is only 1 day sooner) that could put your month on a better trajectory had you not been monitoring that data.
One of the biggest revelations I’ve had after looking at this data for the past 3 years is that often times the work you put in now matters more in the next month than it does in the current month, especially when months start or finish with a holiday.
Of course I don’t want demand to continue to drop (I predict ~10% from December to January) but its better to be aware and informed so you can take the right actions to improve future performance.
Until next time . . .
-Jon


