How Is the Recession Impacting the HVAC Industry?
HVAC Marketing Industry Report - July 2022
I’m kicking off a new monthly round-up series of data for Google and Bing PPC marketing performance across an anonymized sample of our clients compared to the previous month.
This data can help your business because it is a mix of small and large contractors in just about every region of the US - your specific market may differ a little, but you can leverage our findings to keep a pulse on general market trends and benchmark your business performance against it.
I had previously written about how you can use historical data to predict HVAC demand, and the key takeaway is that the data suggests demand softening in 2023.
The below report will help you monitor whether or not that starts to happen and how you can adapt your business to market changes.
Before we dive in, I need your help: conducting user interviews is a critical part of our product development and we want to hear about your experiences using data to operate your business through a short 20-30 minute informational interview.
If you, or someone you know, would be willing to meet with me for an informal interview to answer questions like “tell me about the last time you measured your marketing performance” please reach out to me at Jon@SearchLightDigital.io.
Okay, let’s dive in!
Google PPC Performance - July 2022
In July, we saw HVAC demand soften across the US.
Using the same sample of clients and Google PPC spend between June and July, we saw that:
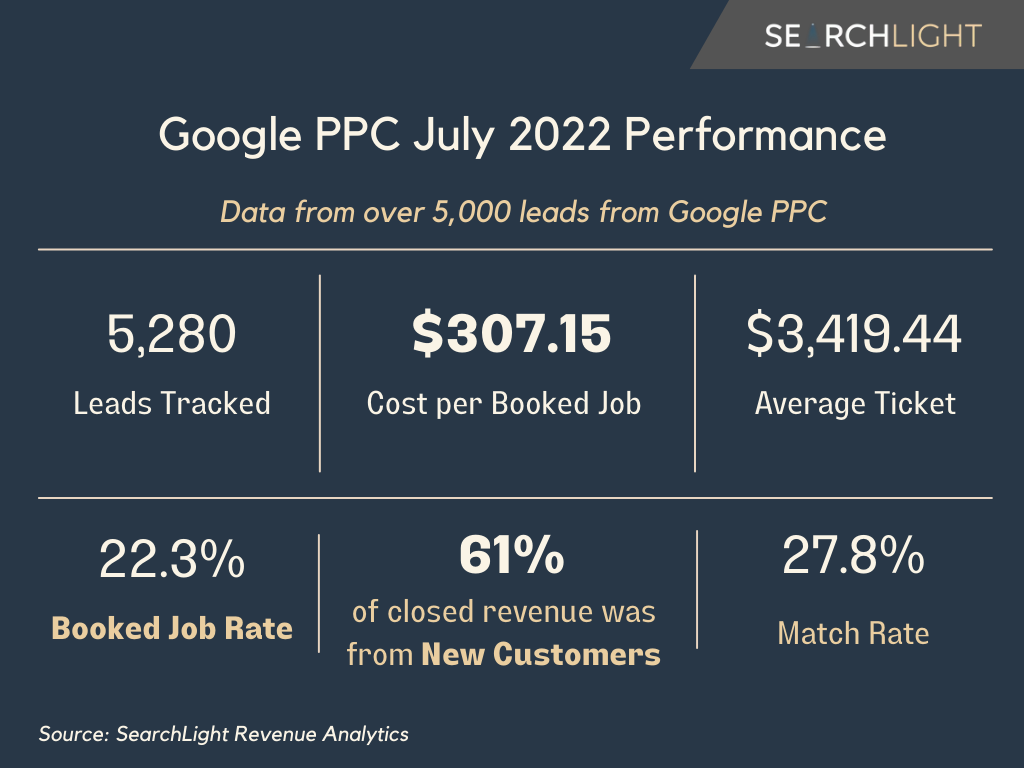
🚨July lead volume dropped by 14% from 6,145 leads in June to 5,280 in July.
⬇️ Match rate (the % of leads that match to new work in the CRM) dropped from 31.26% in June to 27.86% in July.
➡️ Booked job rate dropped from 23.71% in June to 22.35% in June
⬆️ Cost per booked job went up by $59.51 to $307.15 in July from $247.64 in June
⬇️ Average ticket dropped by $884.20 from $4,303.64 in June to $3,419.44 in July
⬇️ Return on sold and closed work from Google PPC dropped to 11.12x in July from 17.37x in June
⬇️ Sold and closed revenue from Google PPC dropped by 35% from June to July
It’s not all doom and gloom:
July lead volume was down 14% and sold/closed revenue dropped by 35%, but on average, $1 in spend on Google PPC returned $11.12.
The key insight here is that booked job rate remained largely the same. 22 out of every 100 Google PPC leads turned into sold/closed work in July versus 23 in June.
That’s not a big difference, but lead volume and average tickets were done.
The lesson? Start cleaning up your lead handling processes asap.
We saw some clients have record revenue months in July because they improved their match rates and booked job rates with less leads and overcame lower average tickets by providing great customer experiences and not letting any leads slip through the cracks.
Bing PPC Performance - July 2022
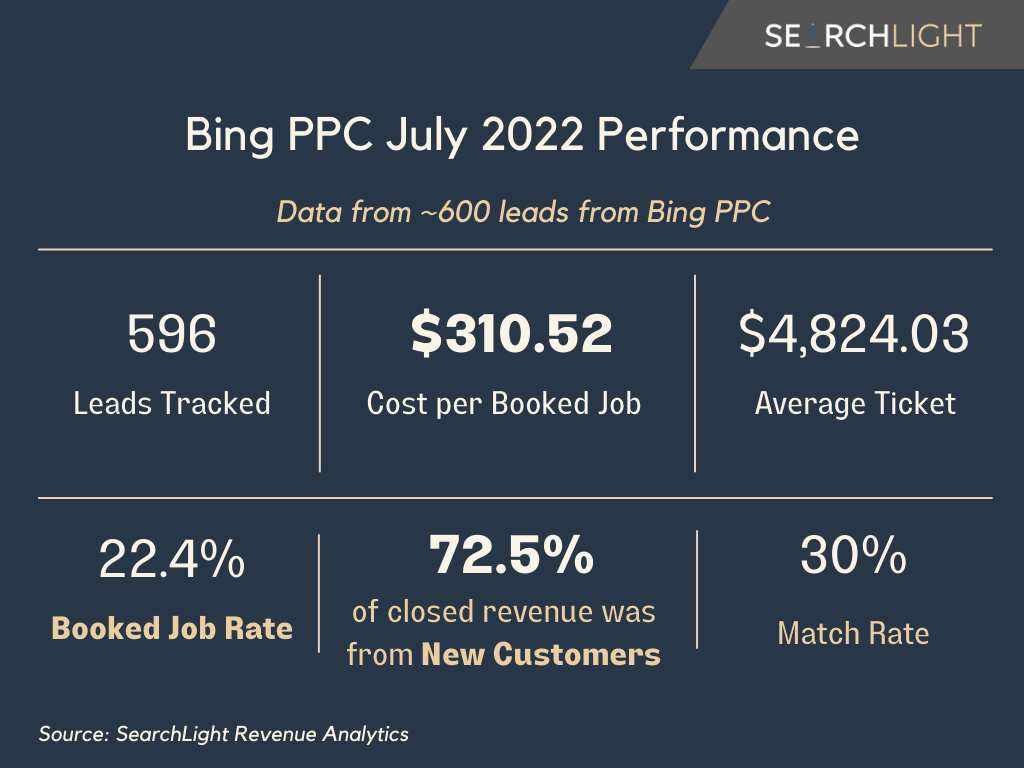
⬆️ July lead volume increased by 2.5% from 581 leads in June to 596 in July.
⬇️ Match rate (the % of leads that match to new work in the CRM) dropped from 32.87% in June to 30.03% in July.
⬇️ Booked job rate dropped from 25.99% in June to 22.48% in June
⬆️ Cost per booked job went up by $42.58 to $310.52 in July from $267.94 in June
⬆️ Average ticket increased by $57.98 from $4,766.05 in June to $4,824.03 in July
⬇️ Return on sold and closed work from Bing PPC dropped to 15.53x in July from 17.78x in June
⬇️ Sold and closed revenue from Bing PPC dropped by 10% from June to July
⬇️ 72.5% of sold and closed jobs came from new customers in July versus 77% in June
Bing lead volume actually increased in July, although only slightly with a 2.5% increase.
Sold and closed revenue took a hit, dropping 10% from June, but for every $1 spent on Bing PPC in July, it returned $15.53.
Key Takeaways
We will release August performance data in the first week of September and are eager to see if summer demand rebounds from June highs.
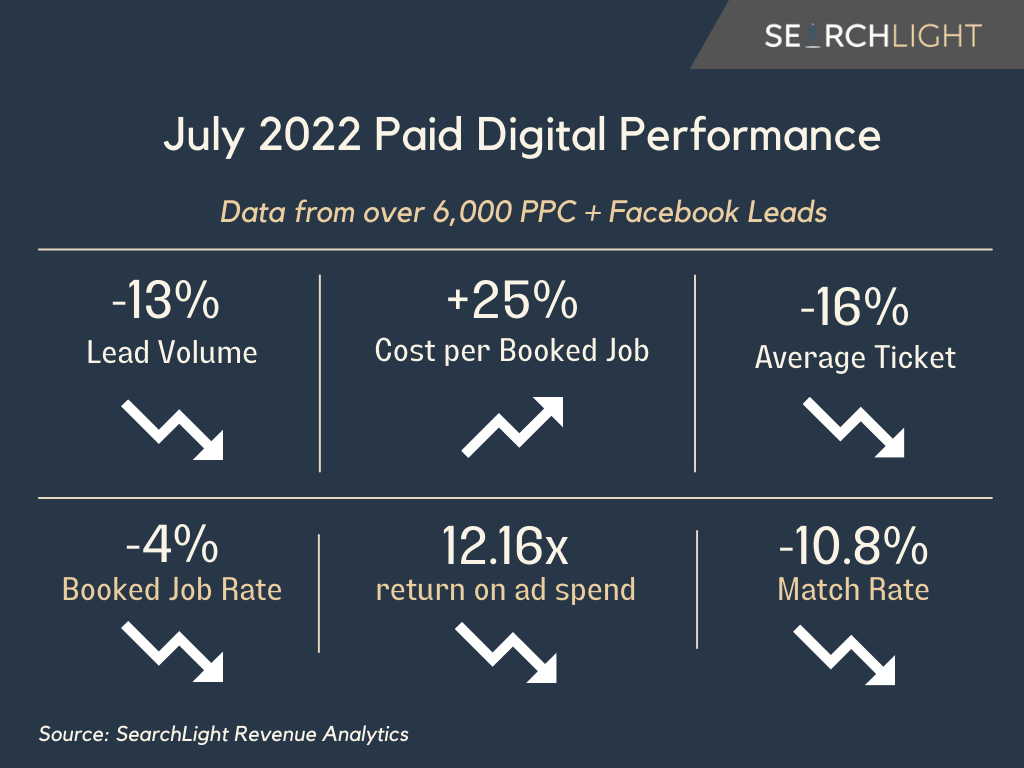
Despite lower lead volumes, booked job rates, match rates and average tickets, the return on ad spend (sold and closed jobs) was still a very strong 12.16x across Google PPC, Bing PPC and Facebook advertising.
That means for every $1 spent on these channels, you would earn $12.16 in revenue in return.
We also need to zoom out and remember that June was a really strong month with a 17.9x return on ad spend (sold and closed jobs), so it’s a very different conversation if we were contracting from a down month.
The key is to continue focus on handling the leads you do have coming in and maximizing them without taking them for granted. Strong process and customer experience can overcome the dips in demand.
Thanks so much for reading.
More to come.


