


HVAC Demand Trends: December 2023 PPC Performance
Year-over-Year and Month-Over-Month Trends Bonus AHRI Data


👋 Hey, Jon here! This week we are going to dive into December PPC performance (Google and Microsoft Ads/Bing) with month-over-month and year-over-year analysis, with some bonus insight from AHRI shipment data!
As a refresher, here’s the final PPC performance data from November (all of the data below is year-over-year):
Conversion Volume: +4% (YoY)
Paying Customers: -3% (YoY)
Customer Acquisition Cost: +3% (YoY)
Total Revenue Opportunity: +18% (YoY)
Closed Revenue: +21% (YoY)
November YoY performance was very strong despite a smaller number of paying customers and increased customer acquisition costs. Revenue opportunity and closed revenue were both up about 20%!
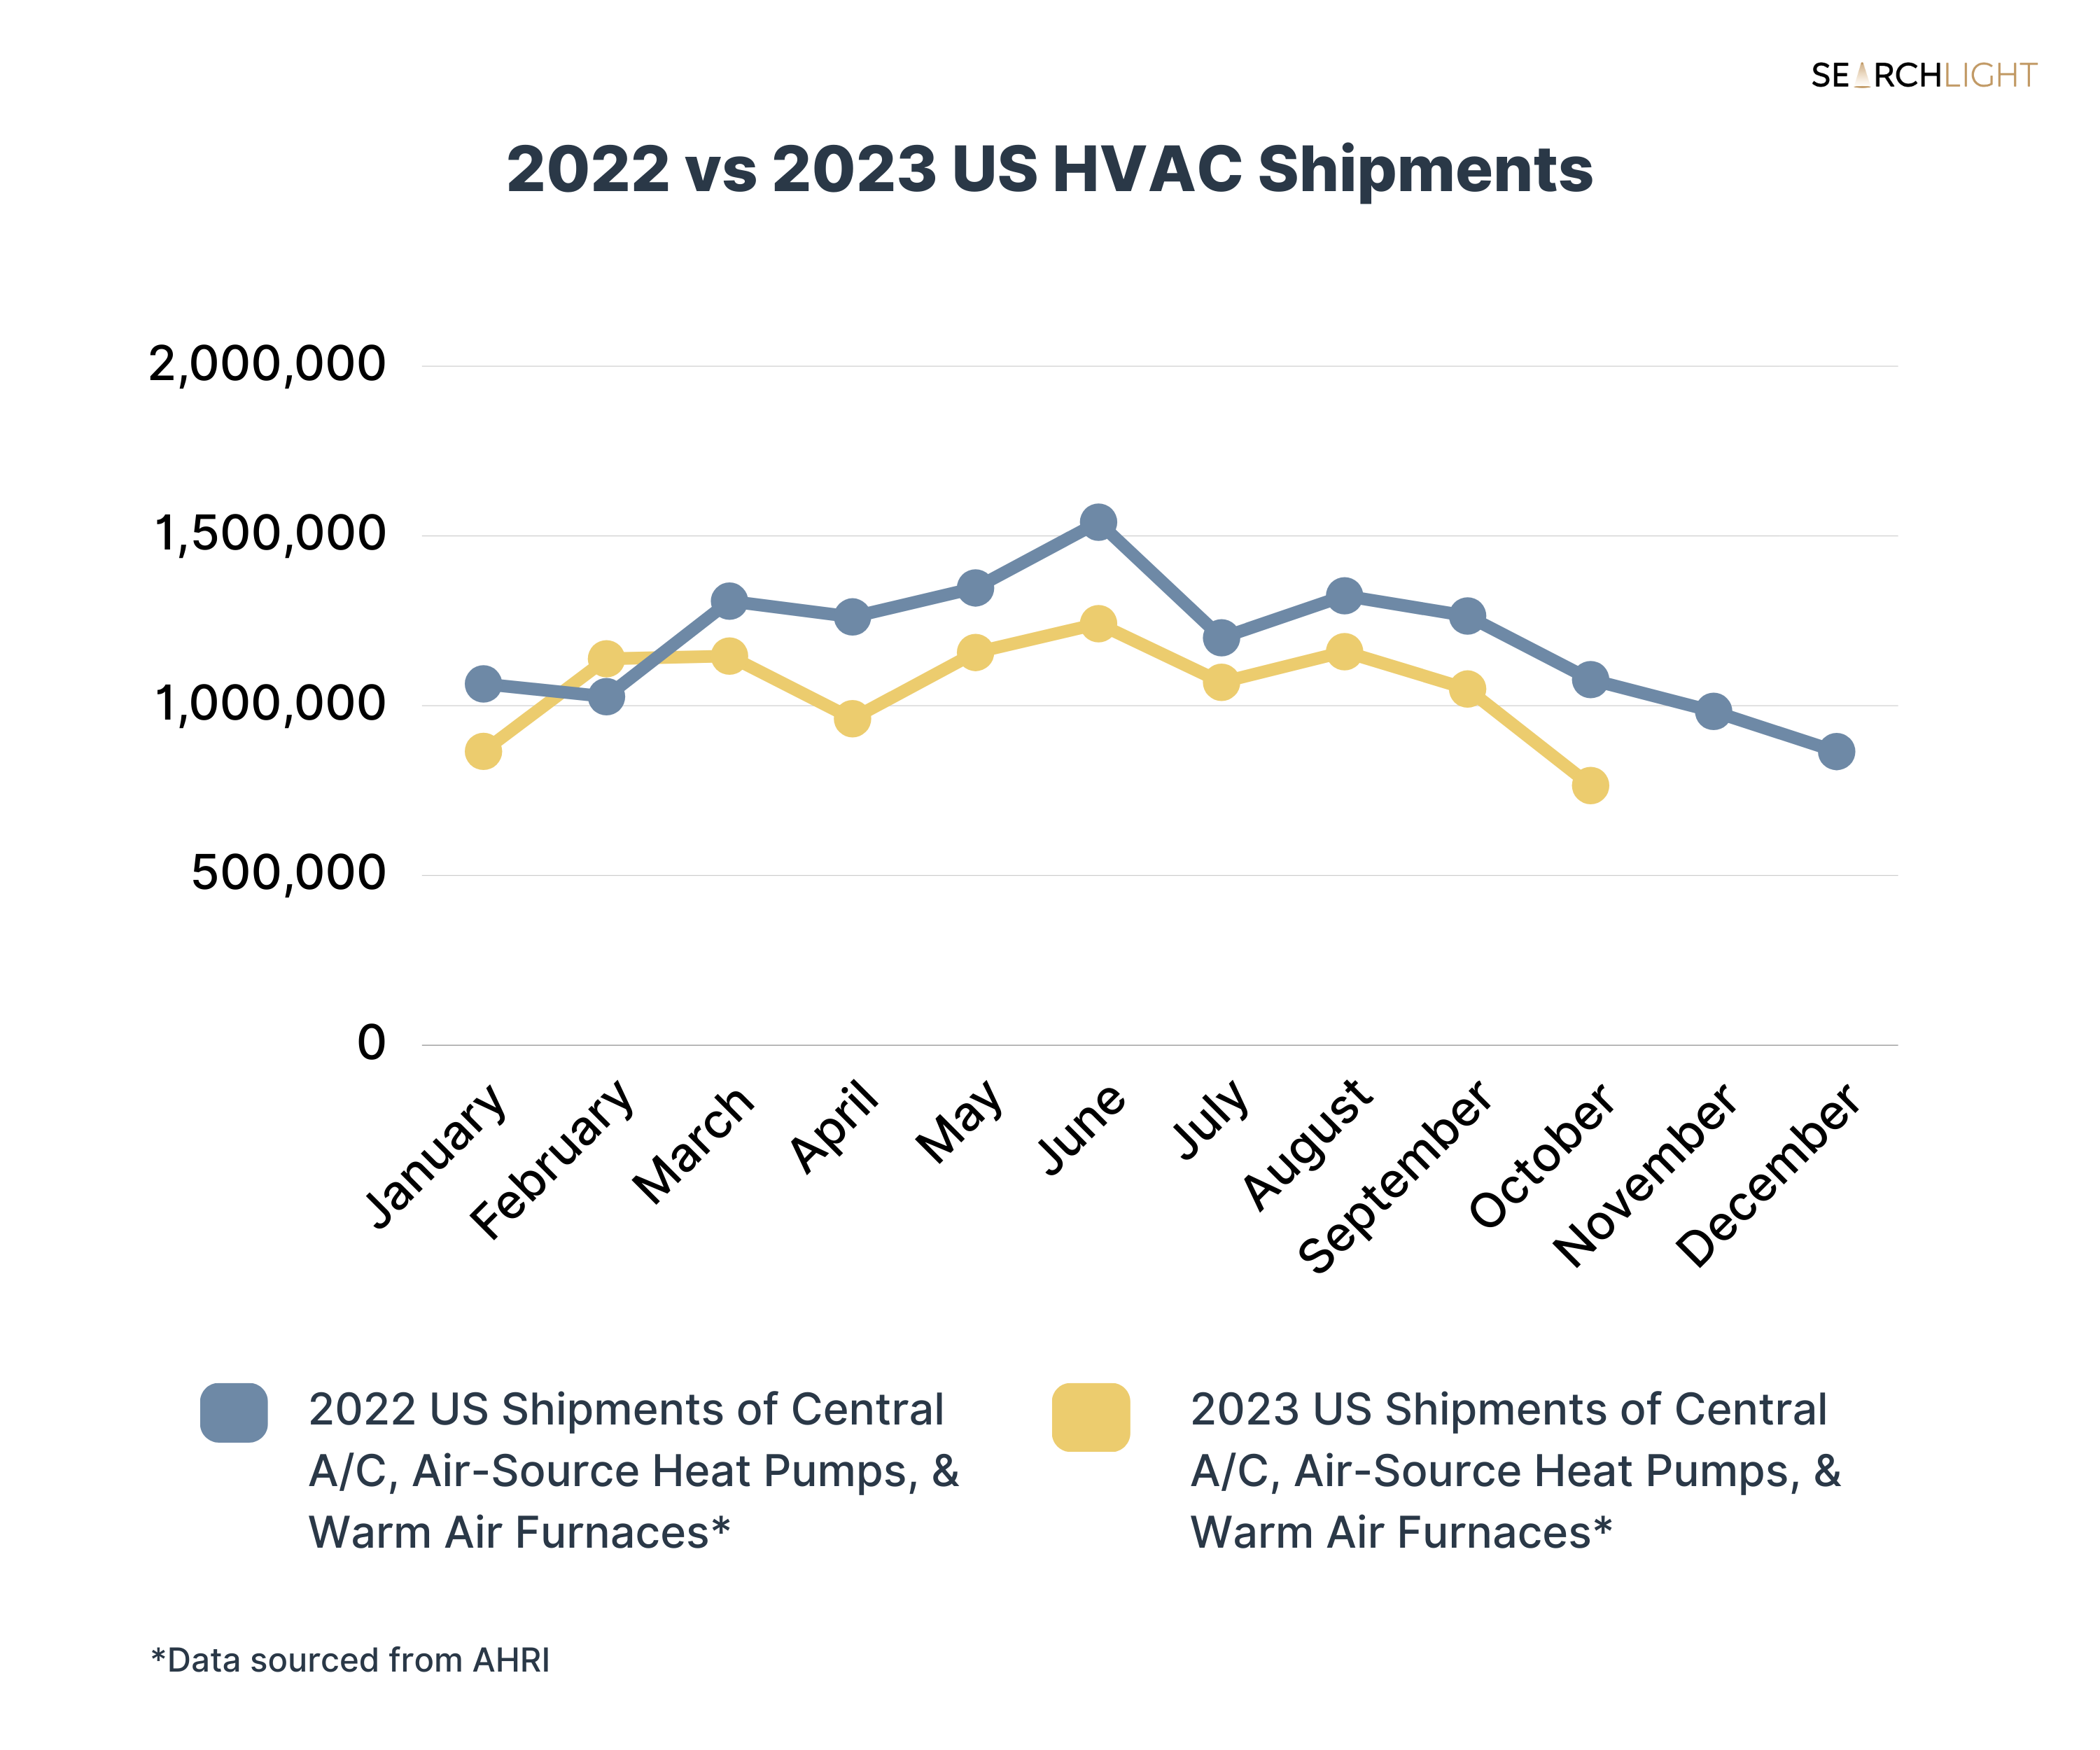
Before we dive into the December data, I wanted to share a chart we put together based on AHRI US shipment data, something I use as a proxy for macro demand to compare 2022 and 2023 trends.
From 2022 to 2023, average shipments of heat pumps, furnaces, and ACs dropped by 15%. With some months, like October, dropping by nearly 30%!
You can see in the chart below that shipments of equipment were less in every month except February ‘23, with downtrends in both 2022 and 2023 toward the end of the year.
AHRI has not yet published data for November and December ‘23, but once they do we will update our chart.
This chart should help provide you with a better view of the macro demand in the US:
Despite these trends, some groups and brands saw increased performance largely due to a focus on revenue flow data using our tracking platform: match rate, paying customer rate, % of open revenue, etc. are all in your control and can help your business maximize revenue despite smaller demand.
With that, let’s dive into the December PPC performance!
Note that spend decreased 12% year-over-year and 17% month-over-month.
HVAC PPC Conversion Volume Decreased by 34% Month-Over-Month and Decreased by 38% Year-Over-Year
Conversions from PPC advertising took a very big hit both month-over-month and year-over-year.
This is the largest dip I saw in 2023 but comes in a month with fewer working days due to two holidays, and no major weather events (unlike last year, which you can read about here).
It’s also important to note that spend dropped substantially both month-over-month and year-over-year as well.
However, match rates did improve both month-over-month and year-over-year, increasing the number of conversions that turned into sellable opportunities.
The overall number was still lower month-over-month and year-over-year, but better lead handling made up for some of the lost volume in conversions.
Data isn’t always going to tell a positive story, but if you noticed a drop in conversions, just keep in mind you weren’t the only business to experience that in December ‘23.
Paying Customers From PPC Were Up 11% Month-Over-Month and 12% Year-Over-Year
Paying customer rates increased about 10% month-over-month and year-over-year, with some leads from November converting in December.
This is a big positive in light of lower conversion volume, but keep in mind that January might start slow given that fewer conversions are spilling over into appointments from December to January.
As a benchmark, paying customer rates were at about 18% in 2022 and 2023, meaning ~1 in 5 active customers in a given period purchased from the business.
Customer Acquisition Cost Was Up 6% Month-over-Month and Increased 18% Year-Over-Year
Despite a lower spend in December both month-over-month and year-over-year, customer acquisition costs from PPC increased in both periods.
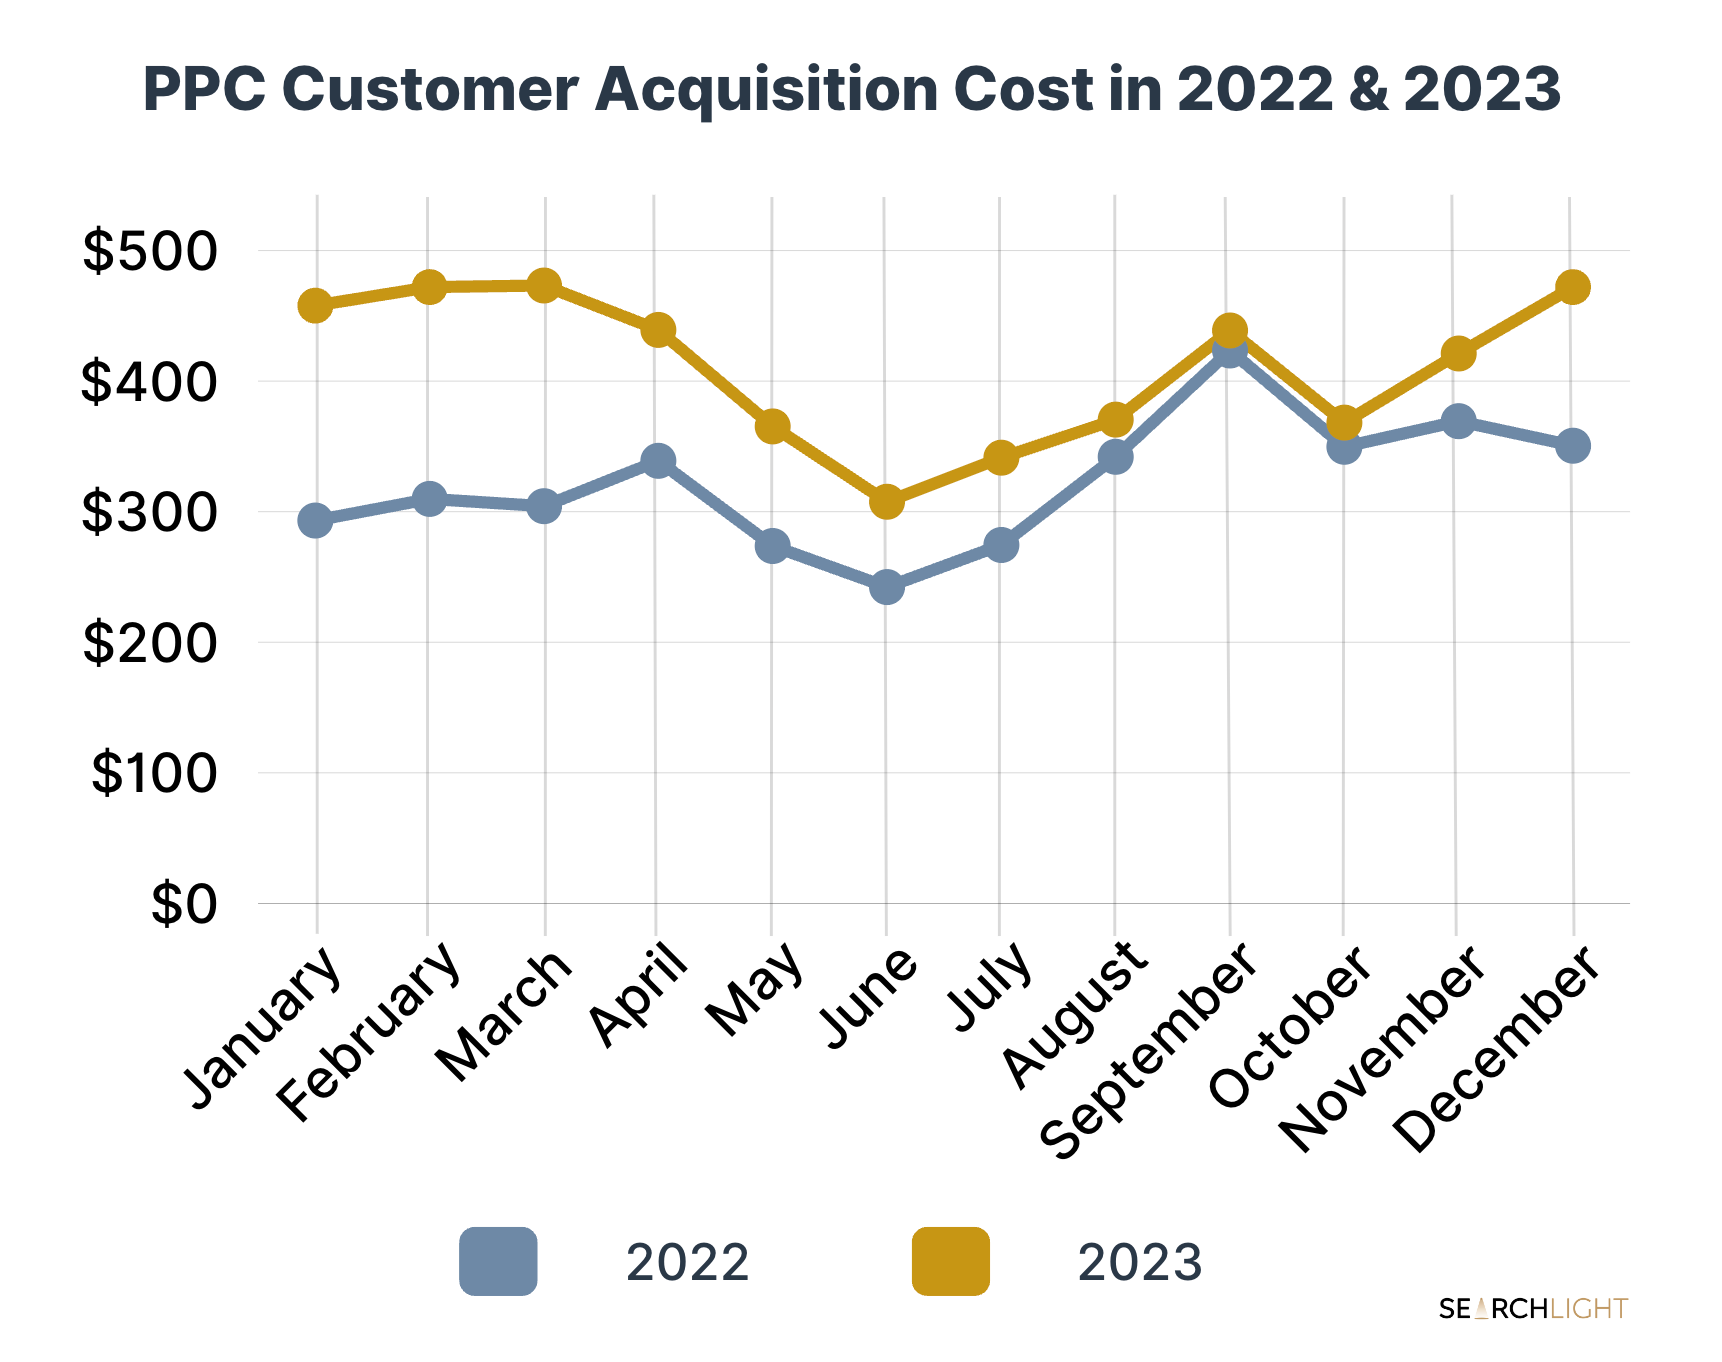
Last year, the average CAC for PPC was a little $400 but this year, but increased to $472 in 2023.
Now that we have our December data point in place, we can look at the 2023 PPC customer acquisition cost trend:

The year finished as it started with January and December at similar CACs and was more expensive than last year.
There were a few months in 2023 where customer acquisition cost was similarly expensive in 2022, but overall, PPC was just more expensive in ‘23:
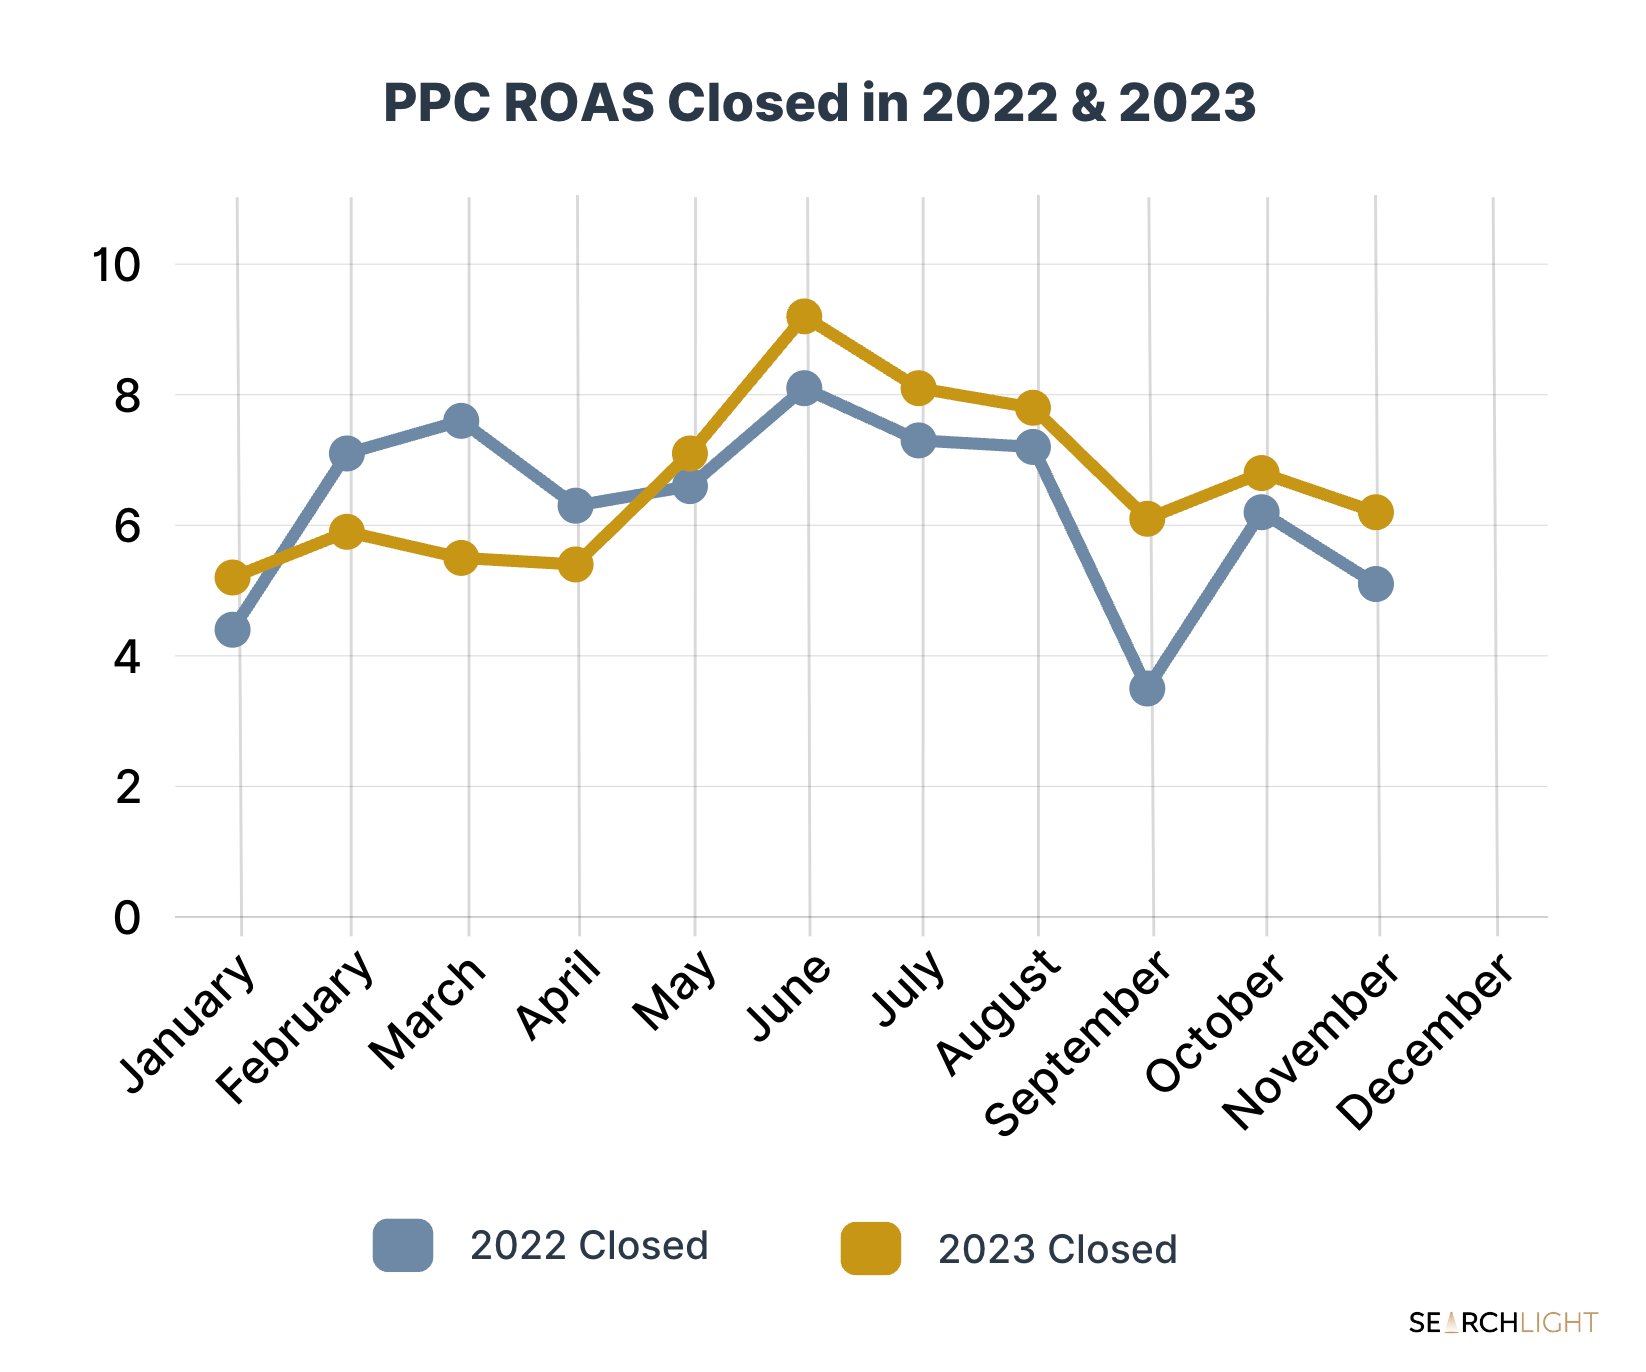
However, as you’ve seen in these newsletters, PPC revenue has also been up YoY in a lot of months as well, especially in the second half of 2023:
Total PPC Revenue Opportunity Was Up 1% Month-Over-Month and Increased 35% Year-Over-Year
Average tickets increased 30% year-over-year and paired with a higher number of paying customers, total revenue opportunity increased 35% YoY despite the large drop in conversions!
This is why conversions/leads only tell such a small part of the story when evaluating the performance of a marketing channel.
There are multiple variables (some in your control) that can overcome these dips in demand and if you know your data and aren’t afraid to look at the “ugly” data points and get strategic about addressing them, you can be very effective in reversing trends.
36% of Revenue Opportunity Did Not Convert via Phone Calls
Each month, I post the % of revenue opportunities that did not convert via phone calls. As I mentioned above, there are ways to use data to your advantage and outperform available demand in your marketplace.
One of the things I constantly discuss with clients is how more and more of your revenue opportunities are converting using tools like forms, online scheduling, chats, etc.
Last month, 39% of revenue opportunity converted via non-phone calls, so it trended down a bit, but you’re leaving dollars on the table if you aren’t formulating good processes to respond quickly to non-phone conversions.
We’ll keep a close eye on this in 2024 to see if this trend continues.
Closed Revenue Was Down 6% Month-Over-Month and Increased 15% Year-Over-Year
The month-over-month closed revenue did take a small hit month-over-month, but not nearly as pronounced as the conversion volume drop.
However, closed revenue increased 15% year-over-year finishing out above a 6x on average in this sample of clients.
So, on average, the businesses in this sample got about $6 in return for every $1 spent on PPC advertising.
January will be the month to watch closely though, because demand slowed enough in December that the pipeline for January was much smaller, and the lowest-performing revenue month in 2023 happened to be January.
Until next time . . .
-Jon
Really fantastic data! I'm excited to measure our performance against these benchmarks.