HVAC Demand Trends: Google LSA Revenue Performance - July 2024
👋 Hey, Jon here! This week, we’re reviewing Google LSA performance for the entire month of July.
Note: This data is from a sample of ~25 businesses across the US. Shout out to Josh Crouch and his team at Relentless Digital, who partnered with us to measure lead-to-revenue from their organic and GLSA management services, enabling us to share these trends with you.
As a refresher, below is a summary of June’s performance:
Spend: +18%
Conversions: +44%
Customer Acquisition Cost: $280.93
Average Ticket: $3,800
ROAS Potential: 20.9x
ROAS Closed: 8.6x
Note that spend on GLSA decreased 16% from June to July.
Conversions from GLSA Decreased by 10% From the Prior Month
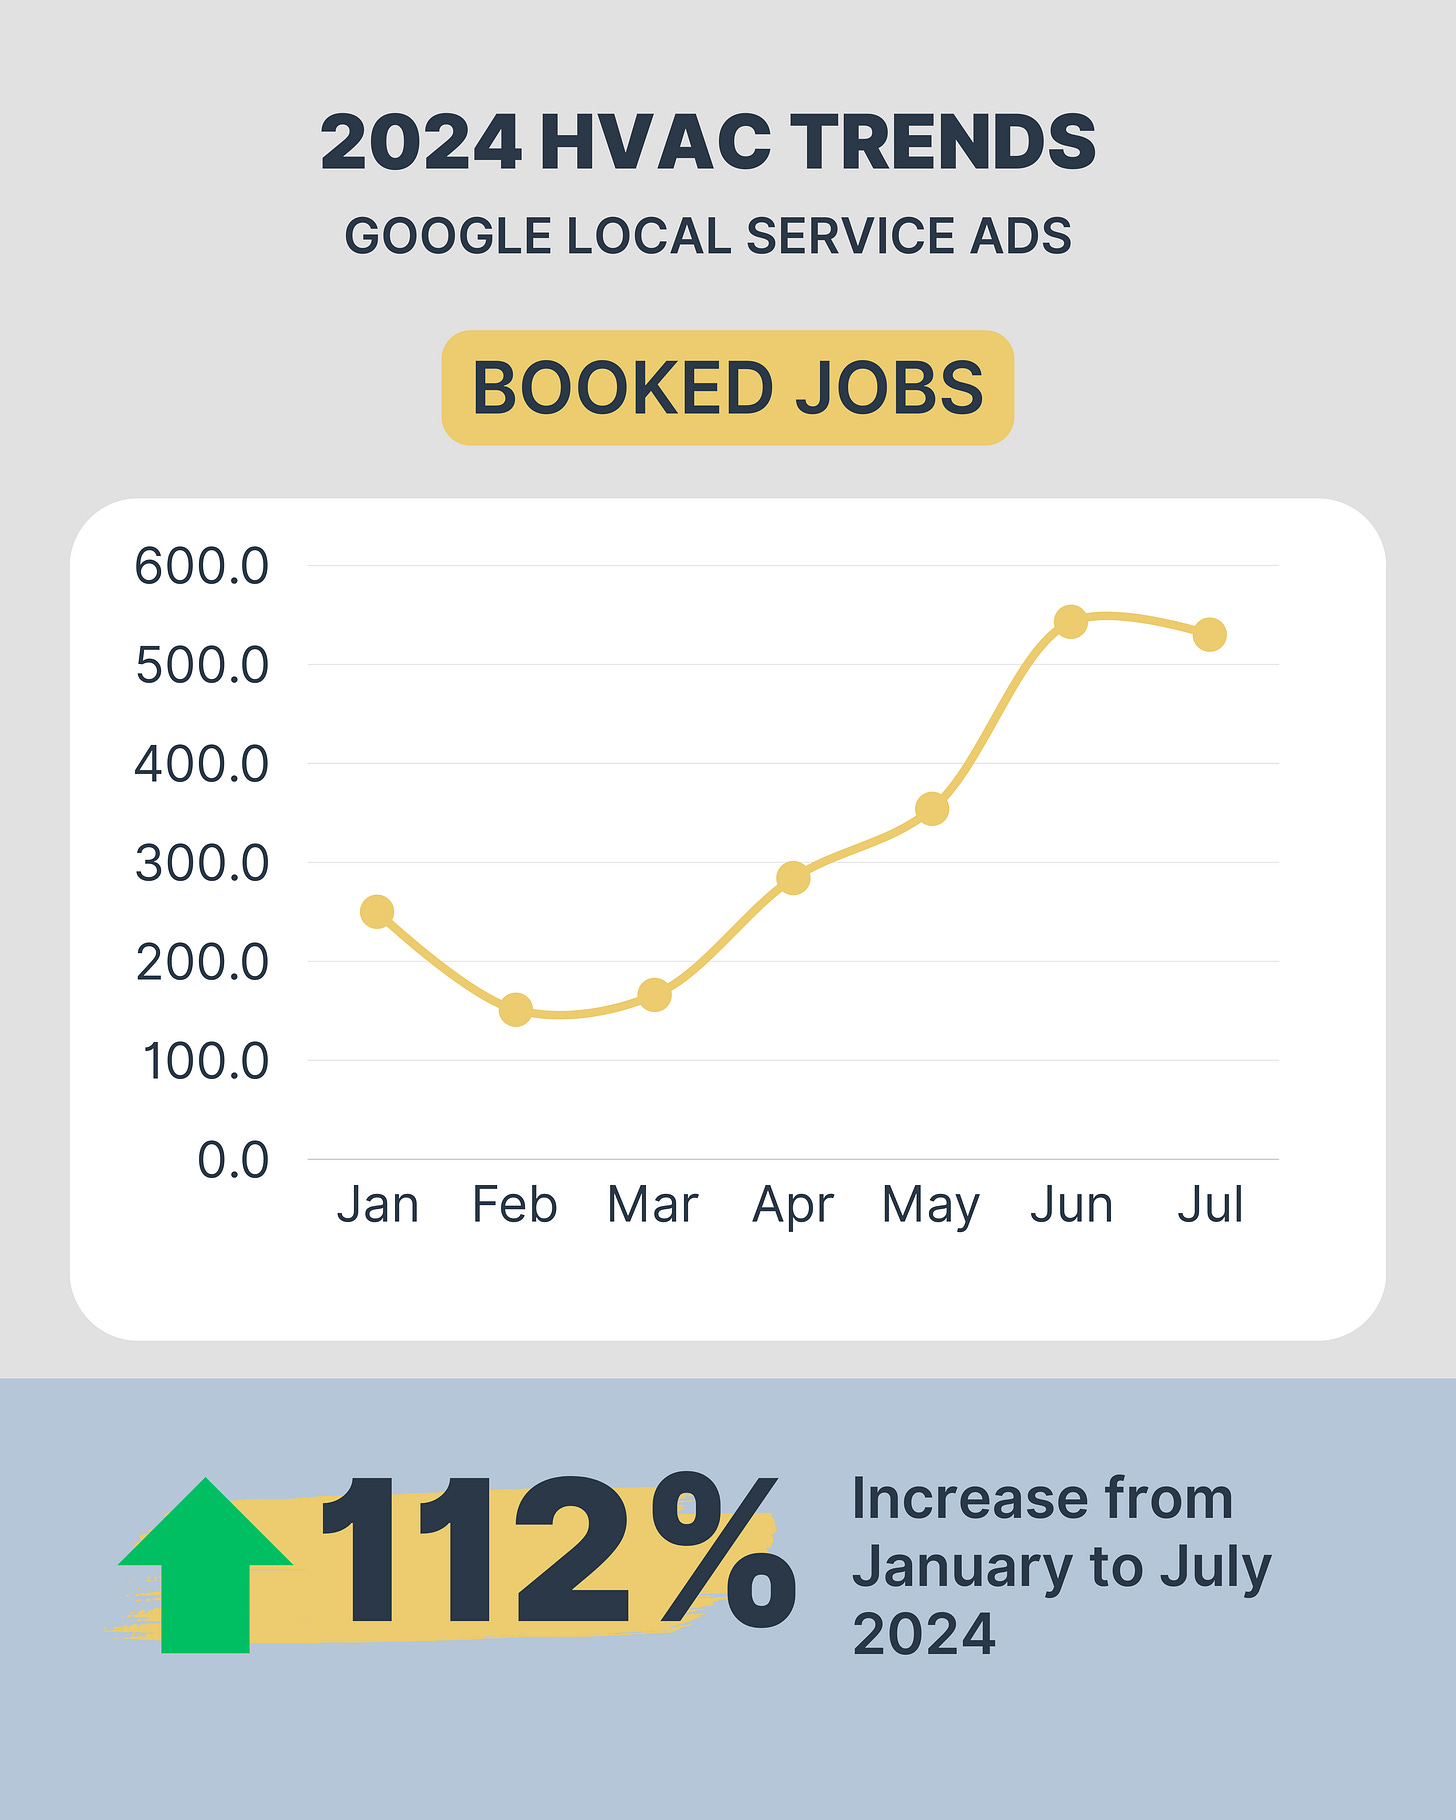
After 3 consecutive months of lead growth from Google Local Service Ads, July lead volumes decreased by 10%.
However, when comparing the lead volume increases from prior months:
63% increase from March to April
19% from April to May
44% from May to June
GLSAs still generated significant lead volume compared to the early months of 2024, and July is the second-highest producing month for booked jobs from GLSAs:
Additionally, the book rate, match rate and paying customer rate on active customers all increased slightly from June to July at an average of 2.5%.
While the volume of revenue opportunity did decrease month-over-month, July still produced strong ROAS numbers compared to June and produced a higher volume of closed revenue!
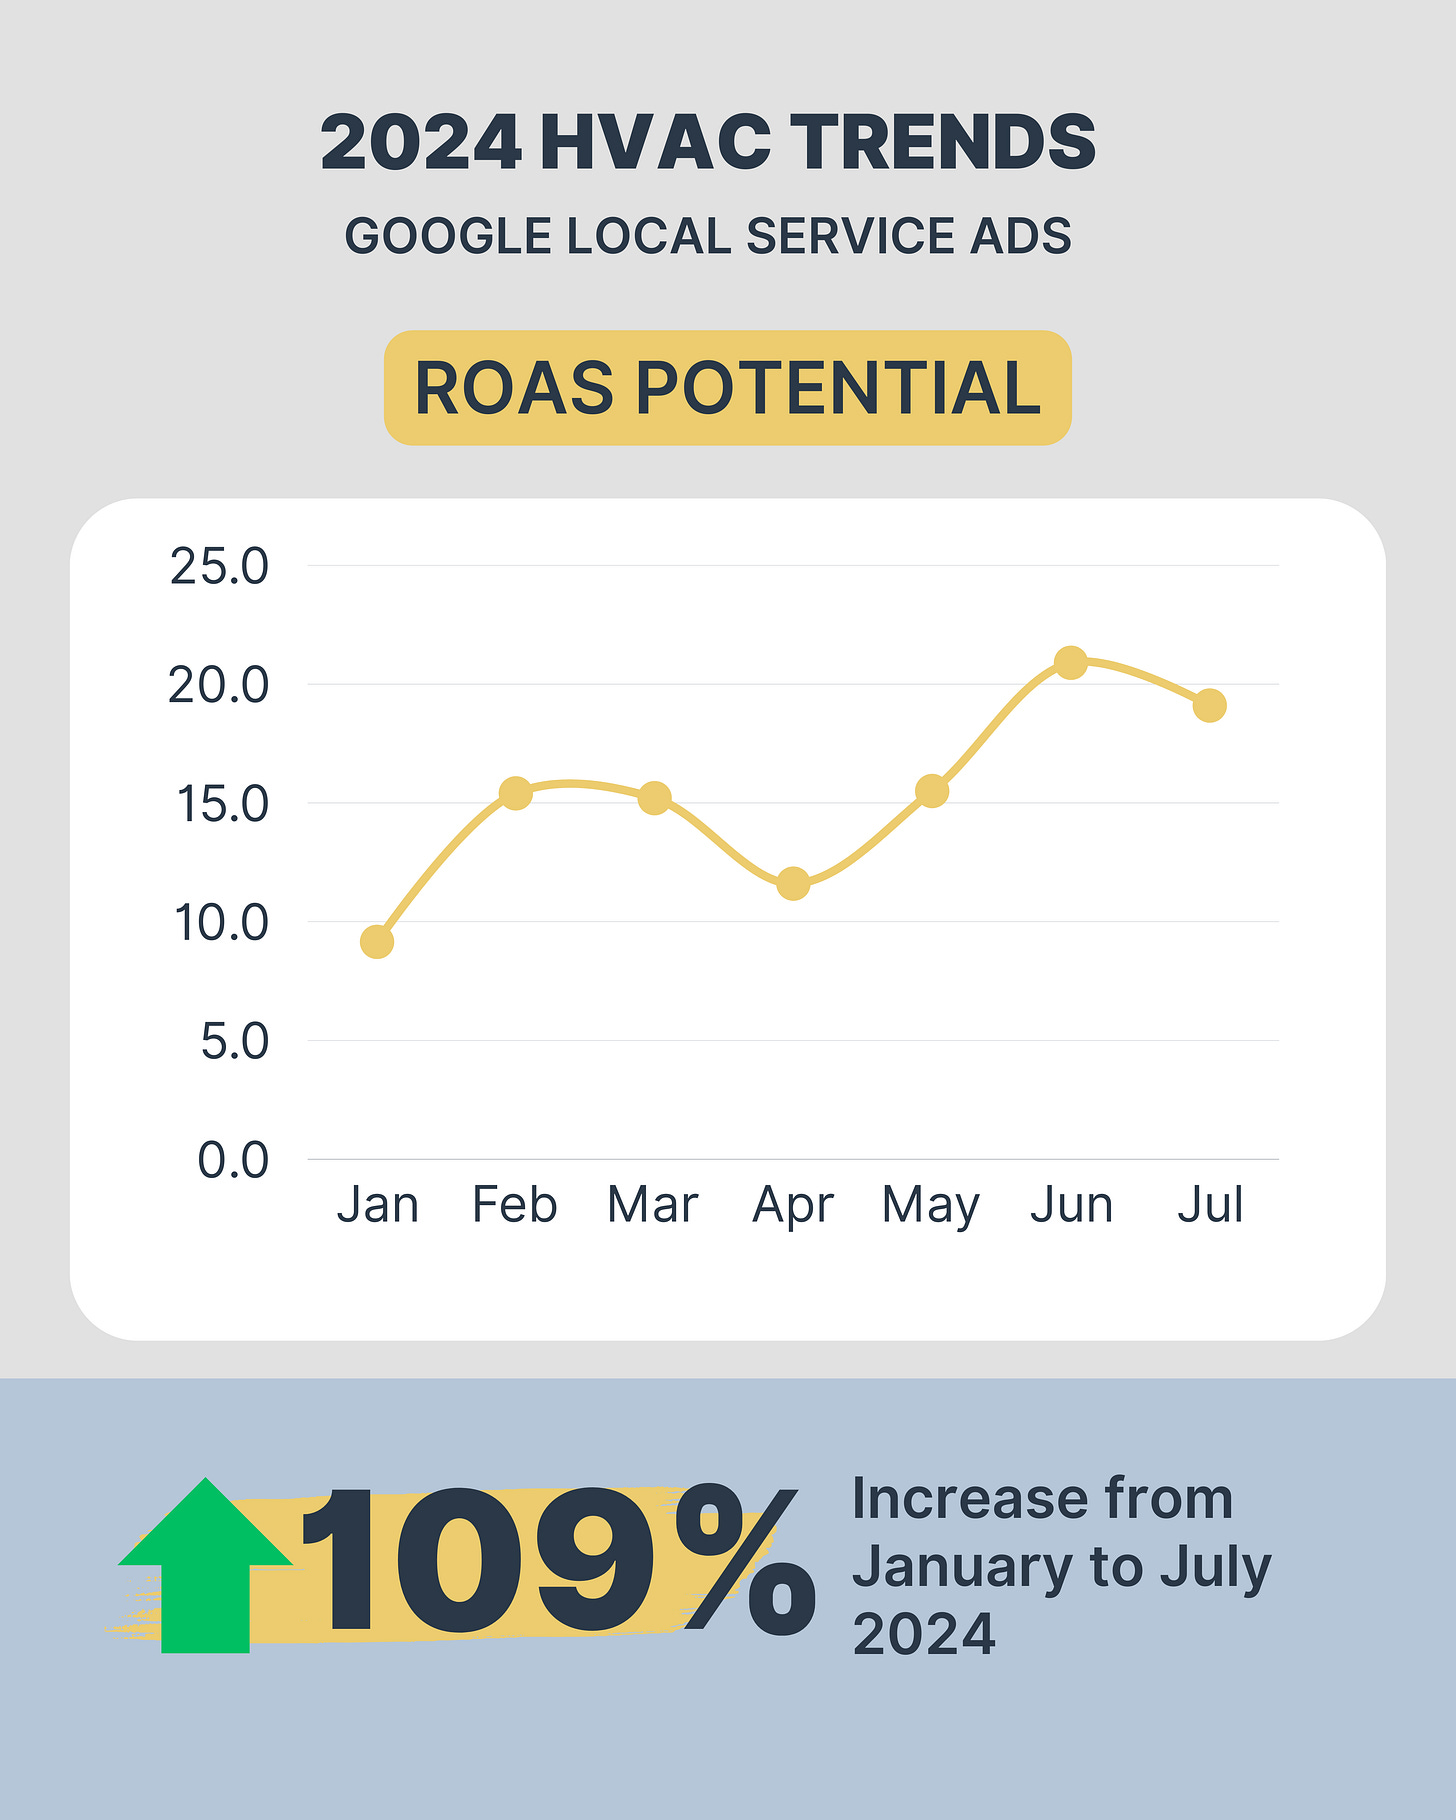
Google LSAs Drove a 19.1x Return on Ad Spend Potential in July
For every $1 spent on GLSA in July, $19.10 of revenue opportunity was generated, up 109% from January (it more than doubled!).
However, total revenue opportunity generated from GLSA (estimates, sold jobs, closed jobs) did decrease by 26% month-over-month.
Still, it’s worth noting that 75% of total revenue opportunity converted to sold or closed revenue, because despite fewer sellable opportunities, the volume of closed revenue increased 13% month-over-month.
Once the contractors got into the homes of these GLSA-attributed leads, the vast majority of them turned into paying customers, which helped make up the revenue difference despite fewer leads and fewer sales opportunities.
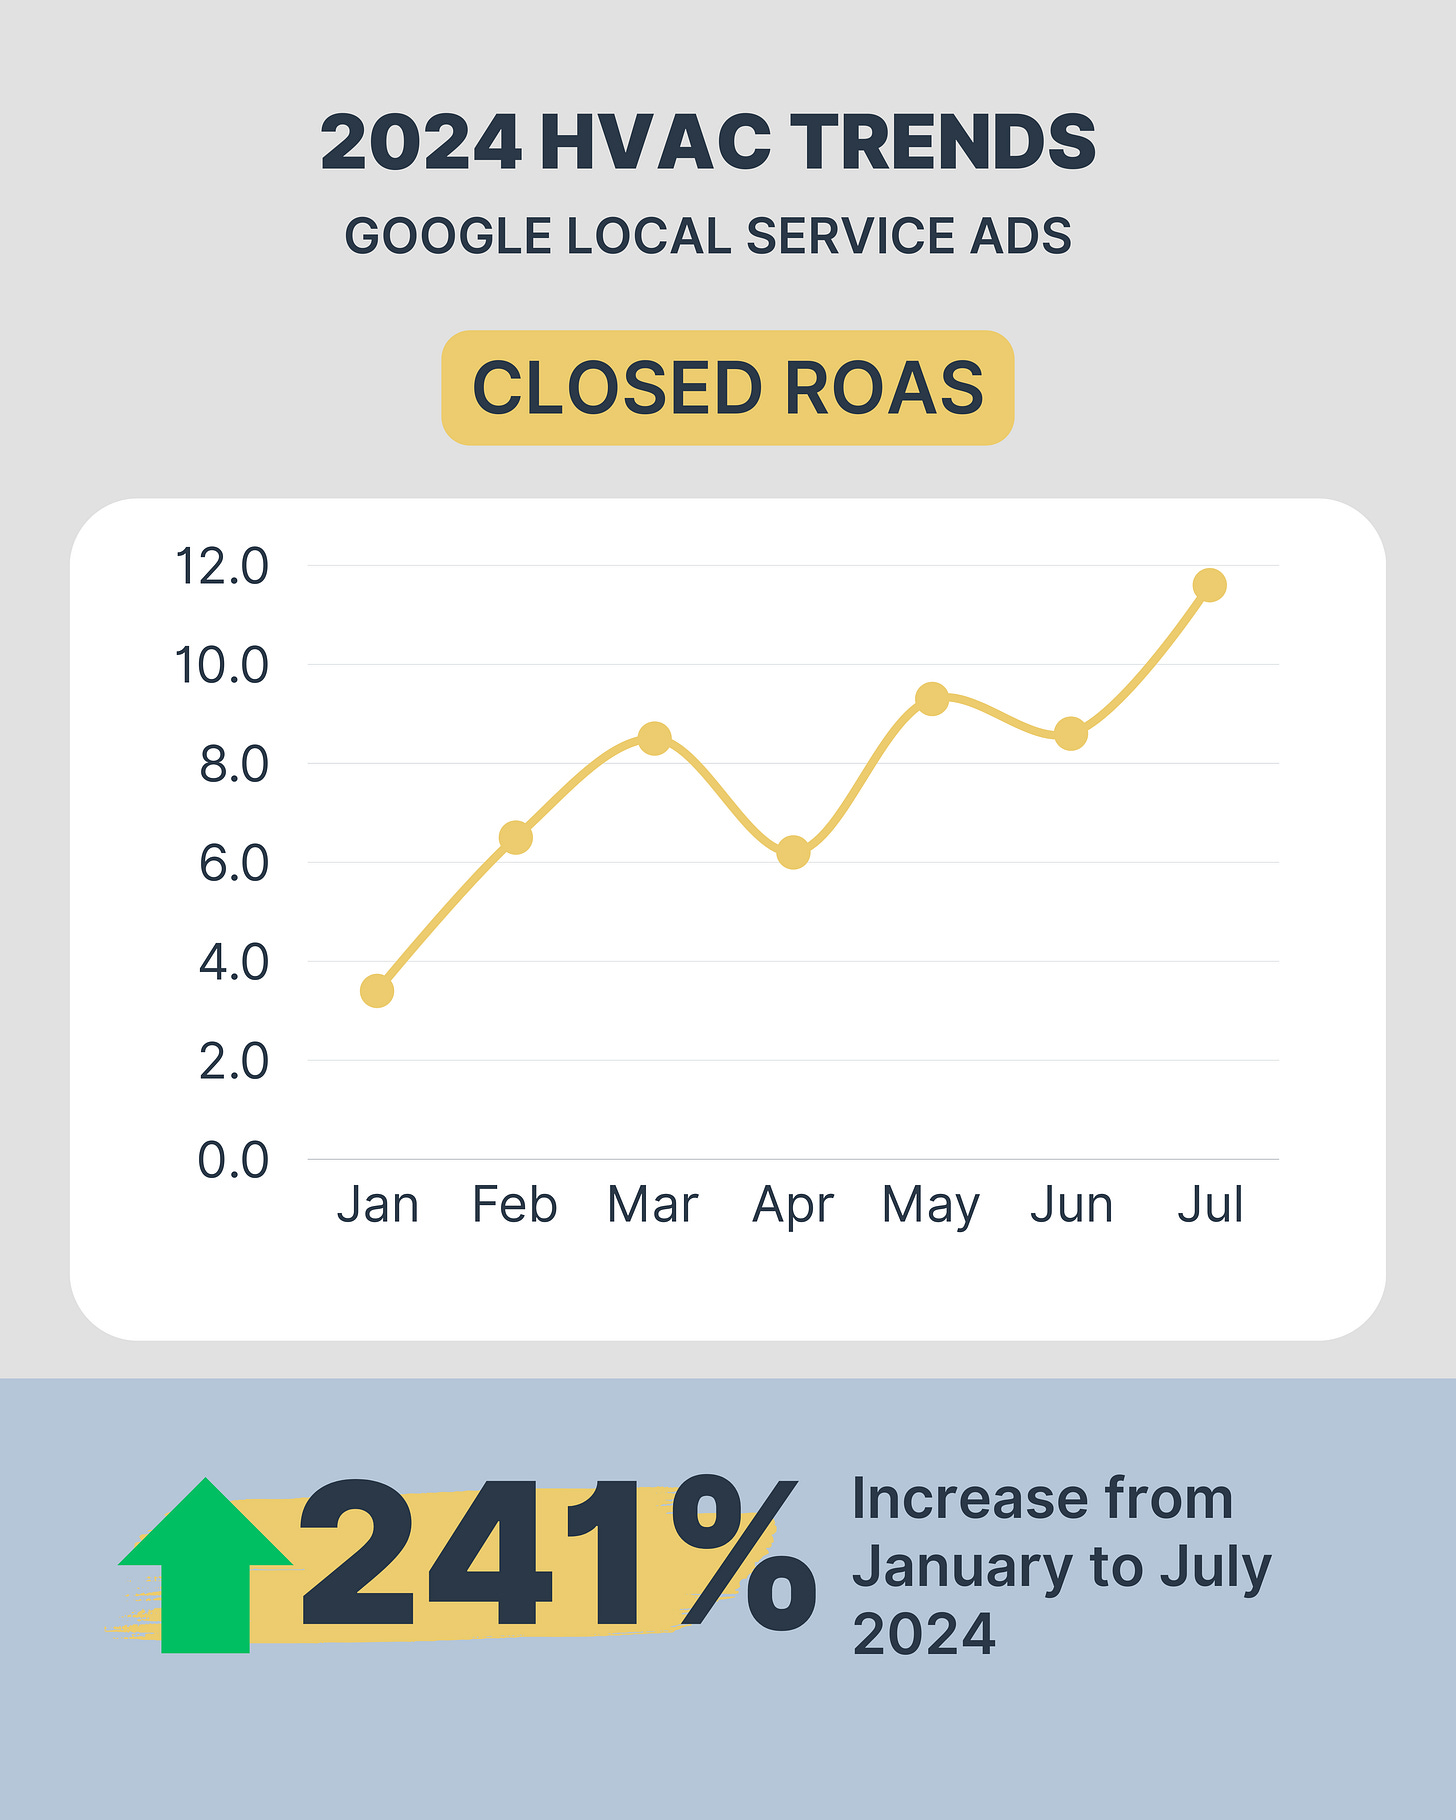
Google LSAs Drove an 11.6x Return on Ad Spend (Closed Revenue) in July
For every $1 spent on GLSAs in July, $11.60 was generated in return, the highest ROAS of 2024 so far.
In addition to record ROAS for 2024, July also produced 13% more total closed revenue than June despite 16% less spend.
As much as I love ROAS, it’s one part of the story - it’s important to look at both ROAS and volume in combination.
For example, it’s a win to get 100x ROAS on a marketing channel, but if that’s only $2,000 of revenue, it’s not that impactful for your business (in most cases).
In this sample, GLSAs generated just over $30,000 in closed revenue per location, while producing $11.60 in return for every $1 spent.
While that is still less than PPC and Organic channels, it’s a solid amount to contribute to monthly revenue targets.
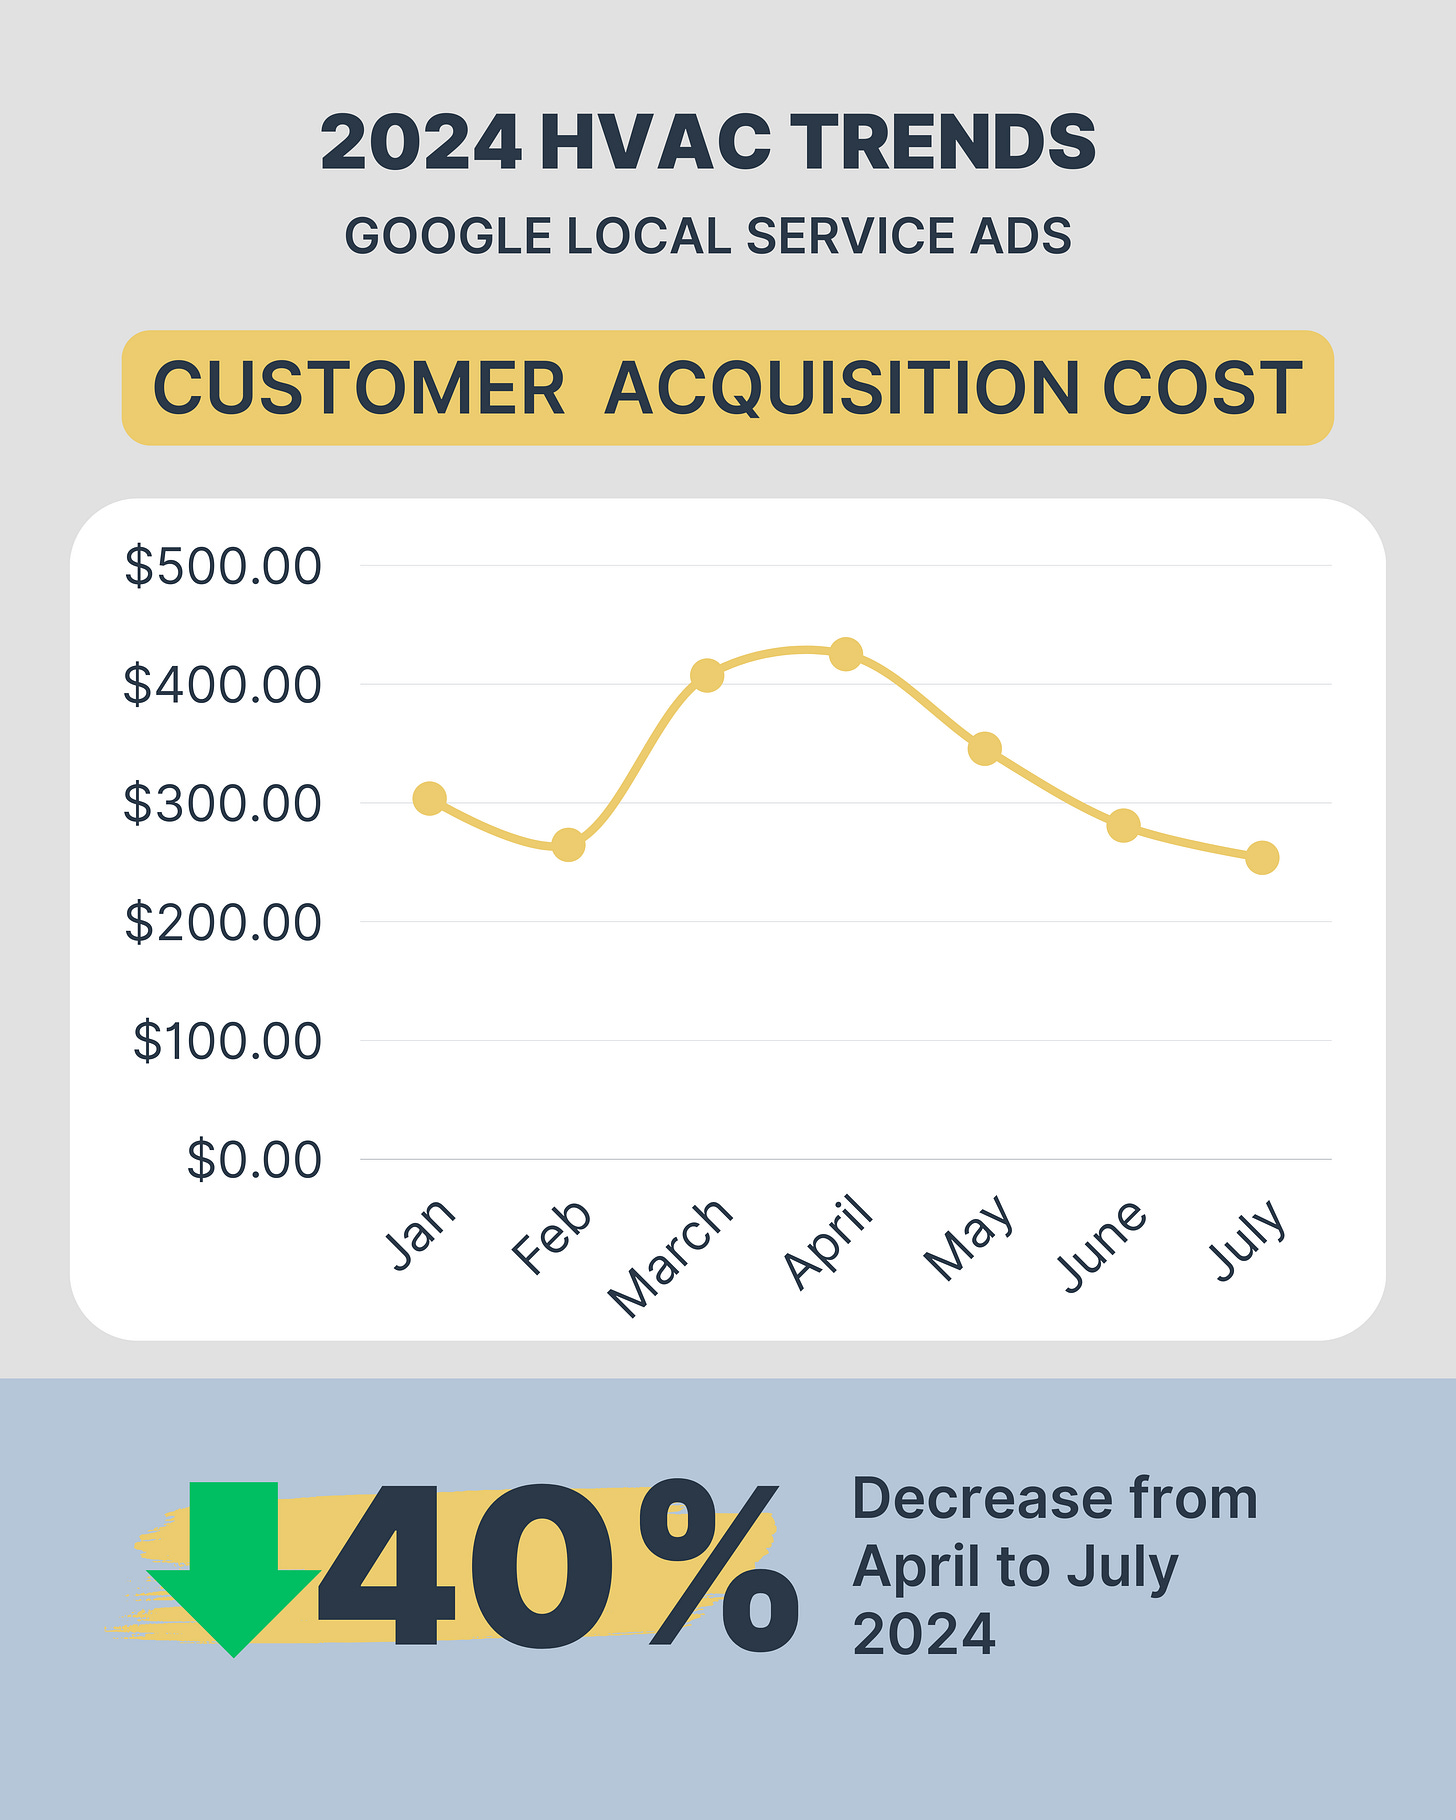
It Cost $253.82 to Acquire a Paying Customer from Google LSAs in July
Not only did GLSAs hit peak 2024 ROAS in July with a higher revenue volume than June, customer acquisition cost also hit it’s lowest this year closing $253.82 to acquire a paying customer from the channel.
This is down 40% from peak in April.
GLSA pricing followed a different trend this year than in years past, with the lowest cost month in February ($264) for most of the year.
It seems that GLSAs are less volatile than they have been, but as you consider your marketing mix in the context of your revenue goals for the remainder of 2024, keep in mind that GLSA hasn’t always been steady.
April suddenly got very expensive, ROAS potential and ROAS closed took a nose-dive, but it’s been a bit up and down, so keep an eye on the data and be prepared to alter your mix as fit for your business.
Until next time . . .
-Jon


