HVAC Demand Trends: Google LSA Revenue Performance - December 2024
👋 Hey, Jon here! This week, we’re reviewing Google LSA performance for December with an expanded data set! This data set required a minimum spend of $1,000 / mo on GLSA, so while averages can be helpful, there’s a big range of performance. The lowest closed ROAS in this sample was just 0.5x, versus the highest at 27x. Spend volumes are high, meaning the businesses in this sample experienced high demand from GLSAs - that may not be you or your market, which is why it is so critical to track this data for your business.
As a refresher, below are the performance metrics (YoY) for November 2024 GLSA:
Spend: +43% YoY
Unique Leads: +32% YoY
Cost per Unique Lead: $58.95 (+10% YoY)
Customer Acquisition Cost: $290.44 (+15% YoY)
ROAS Potential: 17.4x
ROAS Closed: 7x
Closed Revenue per Business: $103,705 (+21% YoY)
Note that spend on GLSA increased 113% from December 2023 to December 2024 to an average spend of ~$16,629 per brand with a median spend of $8,837.
PS - Kevin and I recently joined The Service Business Mastery Podcast with Josh Crouch and Tersh Blissett you can watch the full episode here or watch some of my favorite short clips to get a recap of some insights and anecdotes we shared here.
Let’s dive into the data!
Unique Leads from GLSA Increased by 92% Year-over-Year
With spend up a substantial 113% from the prior year, unique lead volume was also up YoY with a 92% increase.
It’s great to see this increase (along with the consistency over the last few months) because we observed much more volatility with the LSA channel toward the end of 2023 and the beginning of 2024.
Another positive sign is that despite the significant lead increase, book rates were only down slightly (39% for December ‘24), and overall booked customers were up 83% year over year.
While each unique lead did cost more than in 2023:
There were 65% more run jobs YoY and 63% more paying customers.
On average, the businesses in this sample spent ~$8,000 more on GLSA in December 2024 than in December 2023.
That additional spend drove 145 more leads per business on average (from 158 unique leads each in 2023 to 303 unique leads each in 2024).
Of the active customers in December 2024 from GLSA, roughly 19% became paying customers.
Because of that, we can estimate that 16 of those 145 unique leads would convert to a paying customer, and at an average ticket of $2,626, drove $42,016 in additional revenue.
That’s a 5.2x ROI for every additional $1 spent vs. 2023, so it’s safe to say the additional spend was worth it, just like it was in November.
For the second straight month, 27% of unique leads were from new customers, which generated 70% of the total closed revenue (for the second month in a row).
It Cost $291.84 to Acquire a Paying Customer from Google LSAs in December 2024
Customer acquisition costs from GLSA remained steady throughout 2024:
The consistency of CAC is expected as GLSAs are done on a pay-per-lead model (with the opportunity to dispute non-leads). However, there’s still an important dependency on marketing and sales operations.
If your booking rate, match rate, and paying customer rate were to increase or drop substantially, you could see a notable change in those acquisition costs.
In this sample, it cost $68 more to acquire a paying customer from GLSA in December 2024 than in December 2023, but paying customers spent an average of $125 more, more than making up for the additional expense.
Google LSAs Drove a 16.1x Return on Ad Spend Potential in December
For every $1 spent on GLSA in December ‘24, $16.10 of revenue opportunity was generated.
The opportunity comprises estimates, sold jobs, and closed jobs of leads that originated from GLSA (note that we only take one estimate per customer, and a customer can exist in just one of those buckets at a given time period to avoid double counting).
To make this more tangible, across this sample of businesses, $292,197 (up from $257,283 in November) in revenue opportunity was generated from GLSA per business in December, a 76% increase from the year before and completed a nice up-trend to finish the year:
On average, the business in this sample had $126,350 more in revenue opportunity this year than last from spending $8,000 more this year (15.79x ROI potential on that additional spend).
Google LSAs Drove a 7.8x Return on Ad Spend (Closed Revenue) in December
For every $1 spent, GLSAs drove $7.80 in closed revenue.
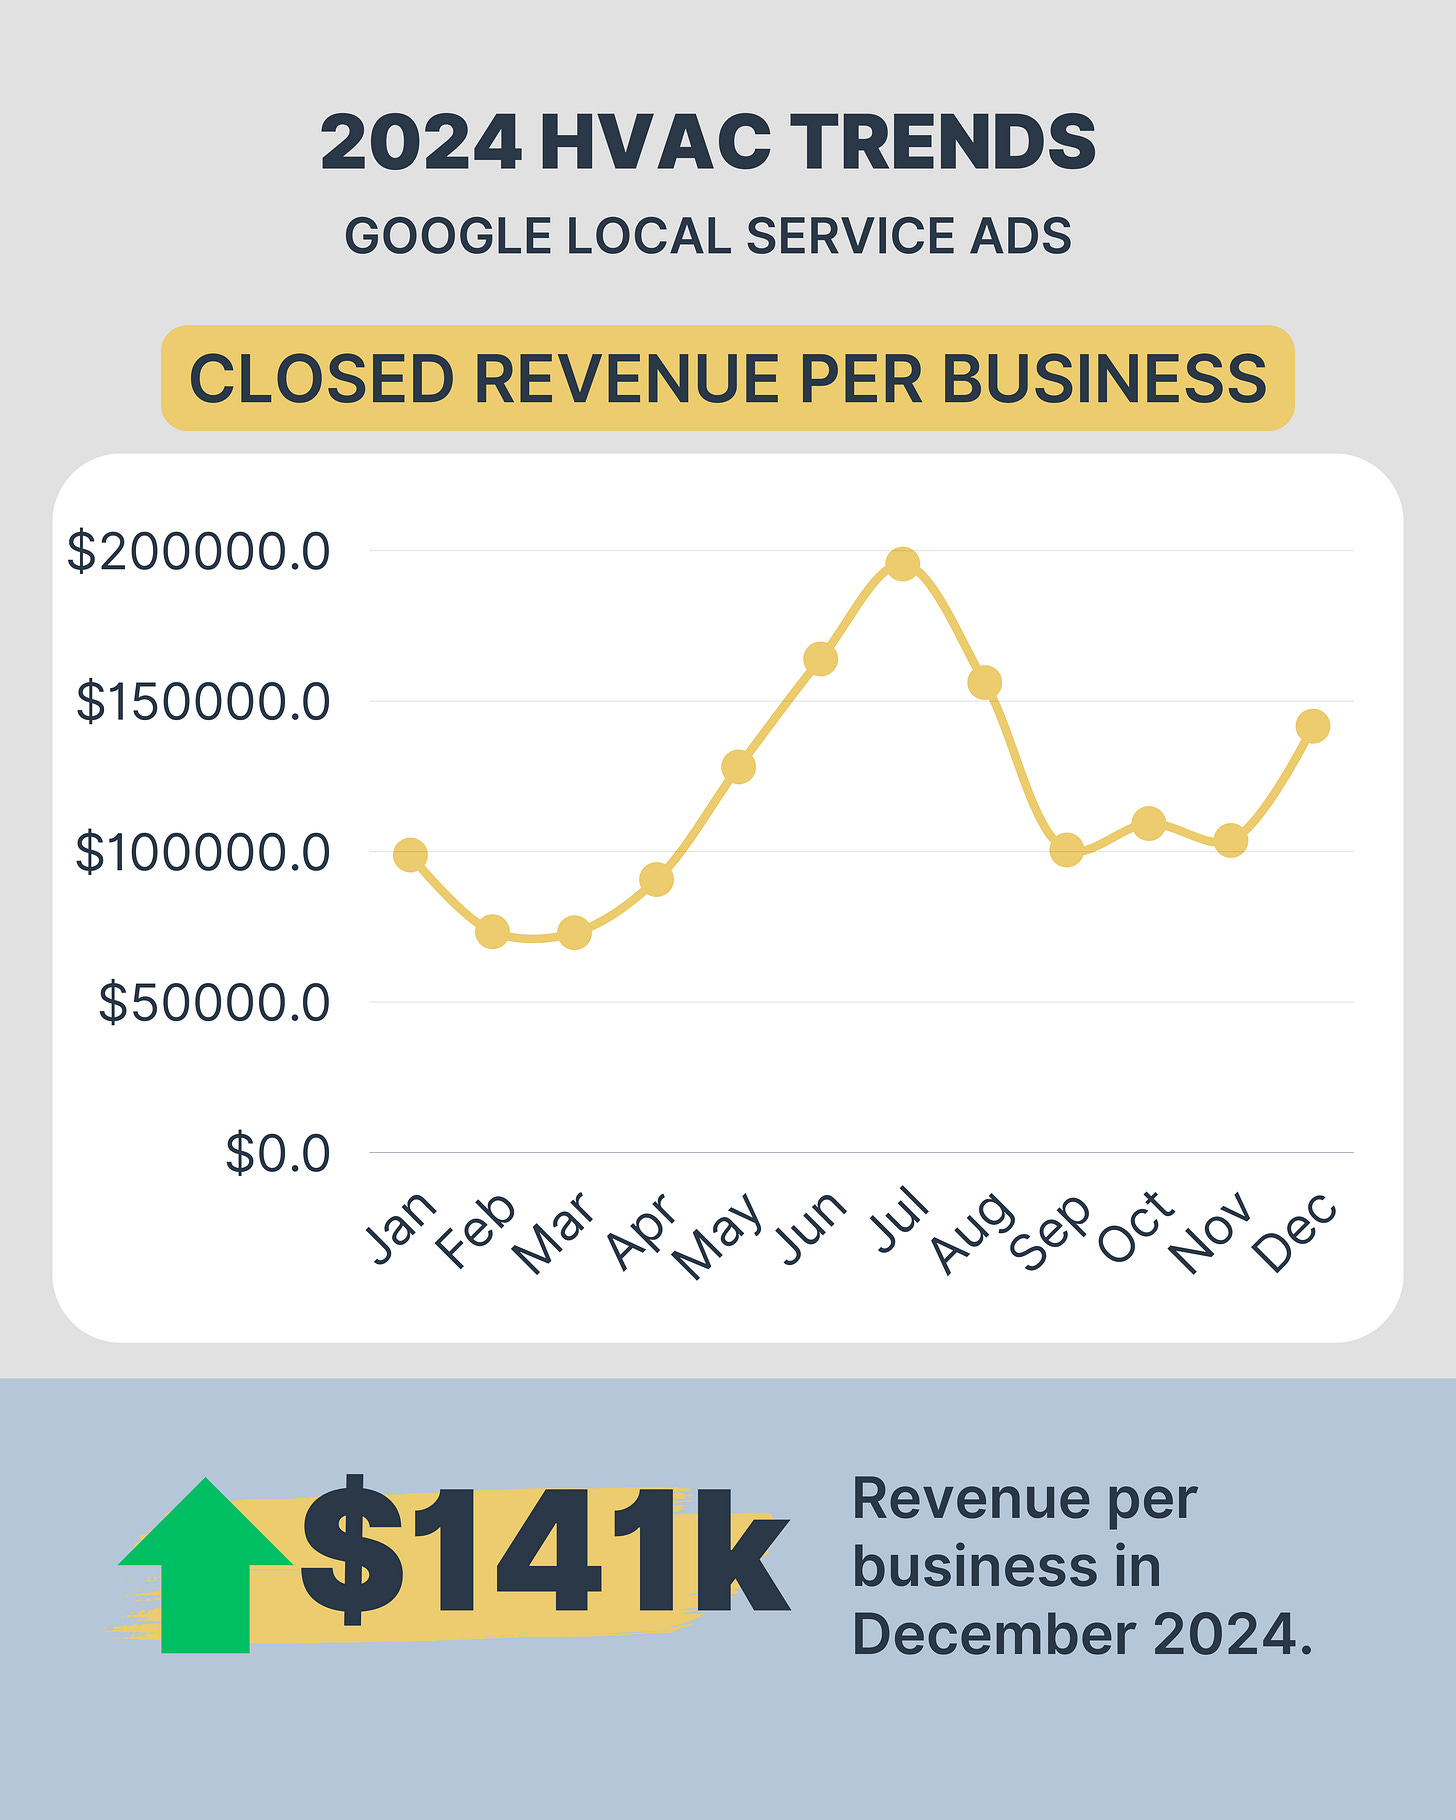
That equated to $141,693 (+71% YoY) in closed revenue per business for December converted by GLSA:
Of this total closed from GLSAs, 70% was from new customers.
Compared to last year, the $8,000 in additional spend per business generated an average of $58,128 in net new closed revenue, amounting to a 7.2x return on ad spend closed revenue on the additional spend.
Overall, December performed well and 2024 finished strong. However, sold revenue month-over-month was down 15%, so let’s take an early look at January in our new preview section below 👇
January 2024 GLSA Preview
We now have 8 days of data for January, so let’s peak at a few trends for GLSAs so far this month (compared to the prior 8-day period):
Spend: +24% MoM
Unique Leads: +22% MoM
Cost per Unique Lead: $58
Customer Acquisition Cost: $253.47 (+6% MoM)
ROAS Potential: 15.1x (-19%)
ROAS Closed: 6.4x (-21%)
Closed Revenue per Business: $30,390 (-2% YoY)
Despite starting the month with less closed revenue than December, January is off to a good start. It’s possible a cold snap can accelerate this performance even more, but just be mindful of capacity and customer experience during those busy times!
Until next time . . .
-Jon


