👋 Hey, Jon here! This week, we’re reviewing Google LSA performance for October with an expanded data set! This data set required a minimum spend of $1,000 / mo on GLSA, so while averages can be helpful, there’s a big range of performance. The lowest closed ROAS in this sample was just 1x, versus the highest at 27x. Spend volumes are high, meaning the businesses in this sample experienced high demand from GLSAs - that may not be you or your market, which is why it is so critical to track this data for your business.
To reset the data with our new sample, below are the performance metrics (YoY) for September 2024 performance specific to GLSAs:
Spend: +26% year-over-year
Unique Leads: +18%
Customer Acquisition Cost: $275.69 (+13%)
ROAS Potential: 21.0x (-6%)
ROAS Closed: 8.9x (-7%)
Closed Revenue per Business: $100,542 (+16%)
Note that spend on GLSA increased 47% from October 2023 to October 2024 to about $15,000 per brand.
PS—Before diving into the data, check out this awesome 7-minute video that Dan Antonelli put together. It features SearchLight’s CEO Kevin Lesage walking through some live data and how it's used by contractors just like you!
Unique Leads from GLSA Increased by 32% Year-over-Year
Throughout this analysis, it is important to remember that GLSA spend increased 47% year over year, so we would expect significant top-of-funnel growth, mainly because GLSA is priced on a per-valid-lead basis.
Because GLSA is priced per valid lead, you can’t raise your budget and expect it to be spent like you would PPC. GLSA competes for valuable digital real estate on Google’s search listing page, and its use can ebb and flow based on customer preference.
Note: That’s why it is important to track all of your digital marketing channels in one place and benchmark them against each other. Reallocating budget is a tool in your toolbox as customer behaviors shift in your market.
Regardless of that ebb and flow, GLSAs for the businesses in this sample experienced a 32% increase in YoY unique leads, with each business in the sample getting 240 leads from GLSA, at a cost of $62.37:
Despite the 12% increase in price per lead, average tickets increased 11% YoY, nearly negating the cost difference.
In October 2024, it cost $6.65 more per unique lead from GLSA than in October 2023, but average tickets went up $275.
It’s also worth noting the break-out of how GLSA leads converted in 2023:
88% of GLSA conversions came from phone calls
11% of GLSA conversions came from messages
1% of GLSA conversions came from online bookings
Versus 2024:
86% of GLSA conversions came from phone calls
13% of GLSA conversions came from messages
1% of GLSA conversions came from online bookings
The 2% shift from phone calls to messages doesn’t seem like a big percentage, but that was 338 conversions or 6 per business in October alone.
If you are running GLSA with messages turned on, make sure you’re checking and responding to those leads in a timely manner!
It Cost $320.47 to Acquire a Paying Customer from Google LSAs in October 2024
Now that we have lead volume and cost per unique lead, we can move down the revenue funnel to look at paying customers and actual customer acquisition costs.
The cost to acquire a paying customer from Google Local Services Ads rose 20% year over year, or $50 per paying customer.
But again, the average ticket increase (+$275) more than made up for this additional cost, along with the volume increase in paying customers.
Due to the increased initial lead volume, the number of booked customers increased by 27%, run jobs increased by 28%, and paying customers increased by 24% (all year-over-year).
The rate at which those customers converted at various steps in the revenue flow funnel did decrease, but only slightly, with a 39.5% raw booking rate (down 3% year-over-year), 34% match rate (down 3% year-over-year) and an 18% paying customer rate (down 6% year-over-year).
Although efficiency slipped a bit, with ROAS Potential dropping 4% YoY and Closed ROAS dropping just under 1%, the revenue volume increase far outweighed the slight efficiency dip.
Google LSAs Drove a 17.3x Return on Ad Spend Potential in October
For every $1 spent on GLSA in October ‘24, $17.30 of revenue opportunity was generated.
The opportunity comprises estimates, sold jobs, and closed jobs of leads that originated from GLSA (note that we only take one estimate per customer, and a customer can exist in just one of those buckets at a given time period to avoid double counting).
To make this more tangible, across this larger sample of businesses, $258,531 in revenue opportunity was generated from GLSA per business in October, a 42% increase from the year before:
You can see revenue opportunity per business charted out over 2024 above, with revenue opportunity peaking in July and settling in October, which still generated more revenue opportunity than January, February, March, and April of this year.
Of this total revenue opportunity from GLSAs, 76% was from new customers.
Google LSAs Drove an 8.5x Return on Ad Spend (Closed Revenue) in October
For every $1 spent, GLSAs drove $8.50 in closed revenue.
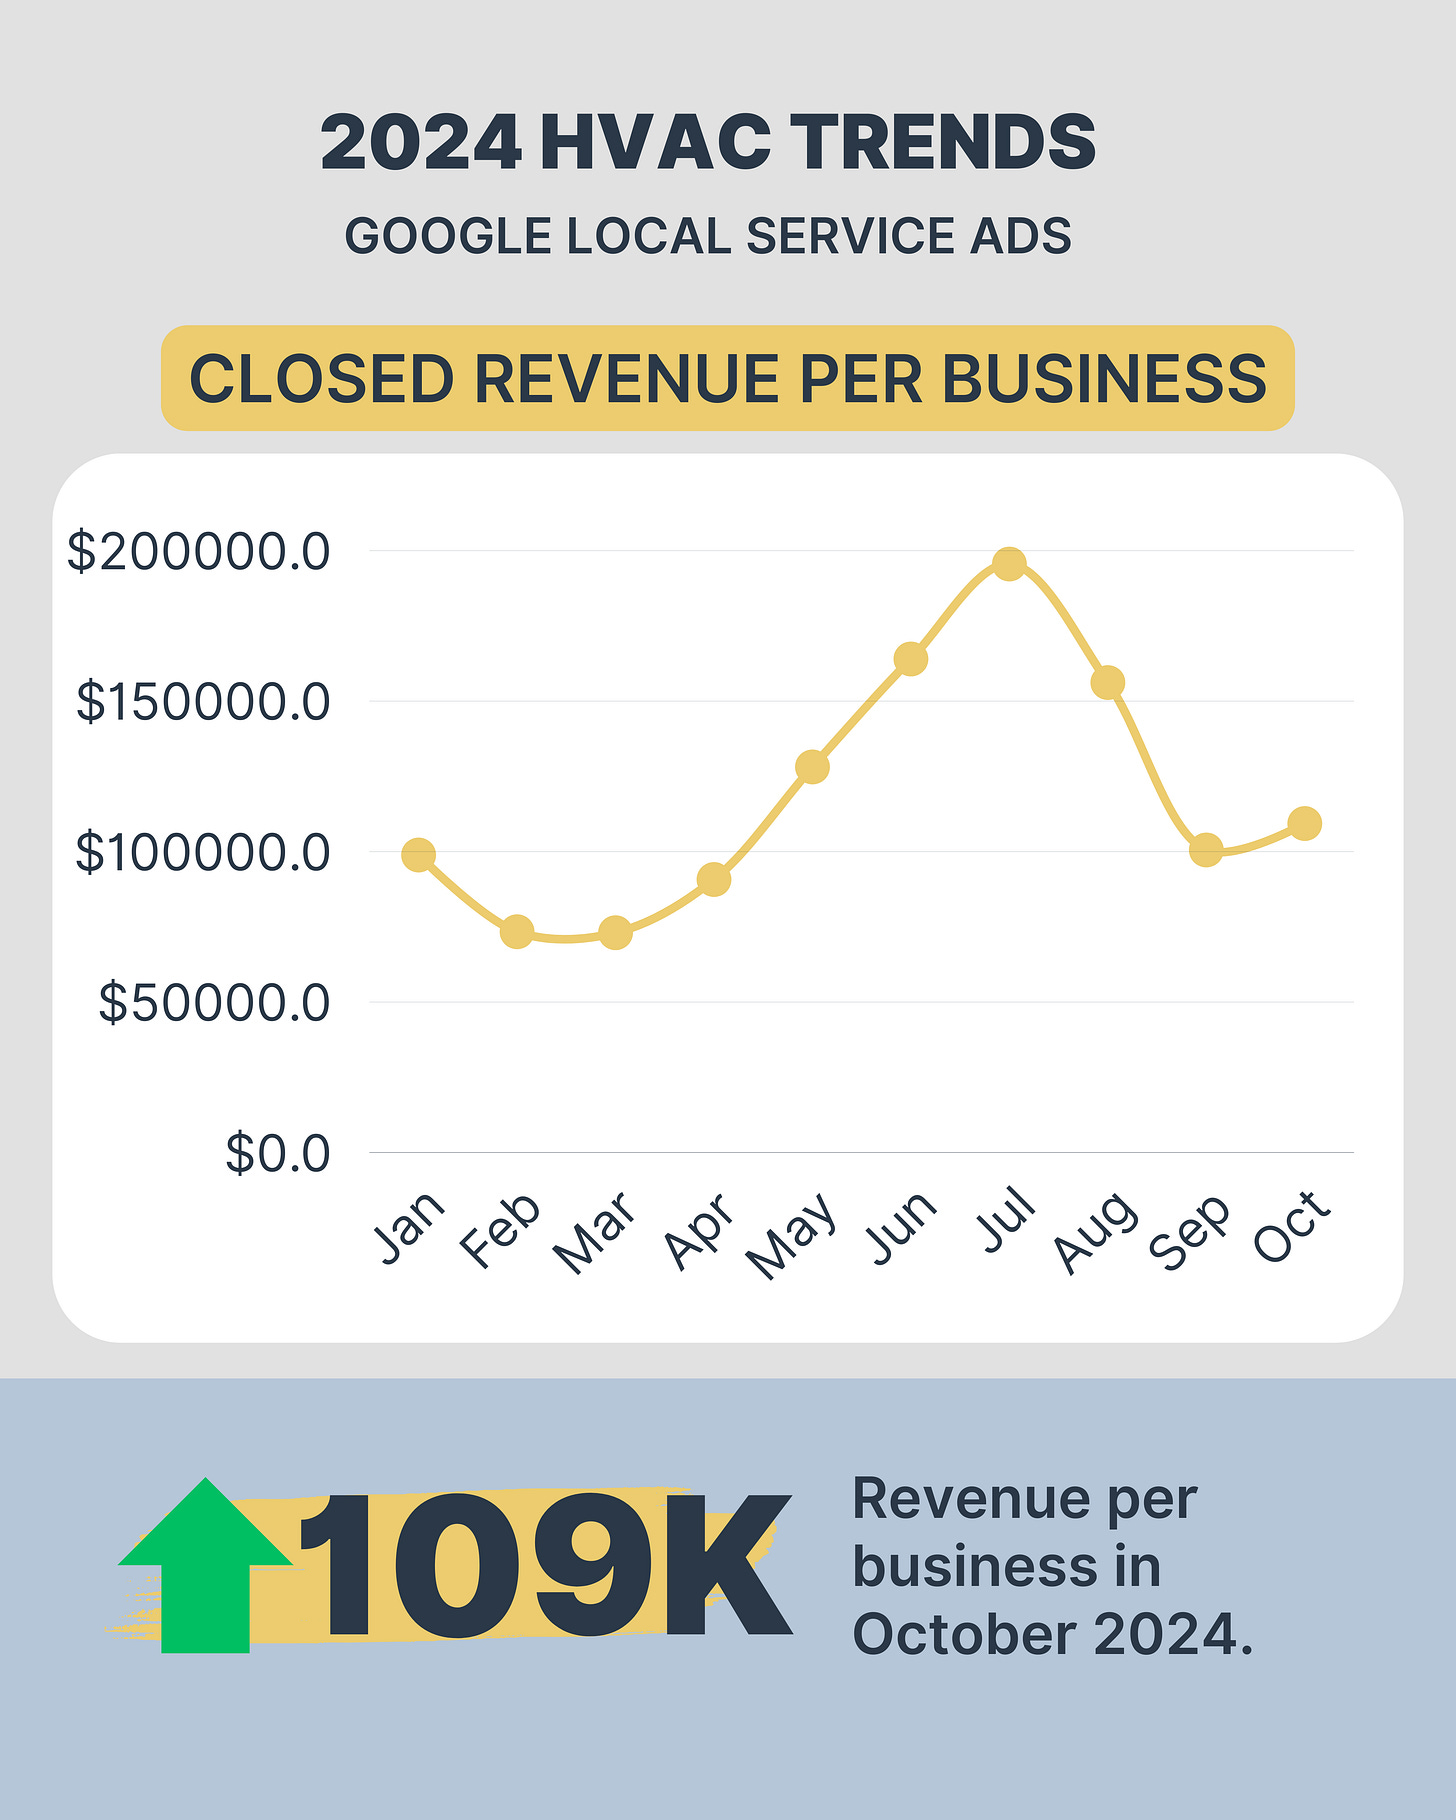
That equated to $109,315 (+46% YoY) in closed revenue per business for October converted by GLSA:
Of this total closed from GLSAs, 71% was from new customers.
Again, remember that the average spend for the brands in this sample was about $15,000, so the volume numbers mentioned throughout may look a little different if you can’t spend those amounts.
For some brands, GLSA works very, very well. For others, it’s very volatile, like feast or famine (there’s almost a 4x difference in closed revenue when comparing February and July, even when factoring in shoulder season; that’s a big swing).
Keeping a close eye on the metrics can help you determine your business's best allocation and specific goals.
Until next time . . .
-Jon


