


HVAC Demand Trends: March 2024 PPC Performance
Year-over-Year and Month-Over-Month Trends


👋 Hey, Jon here! This week we are going to dive into March 2024 PPC performance (Google and Microsoft Ads/Bing) with month-over-month and year-over-year analysis, including Q1 trends.
As a refresher, here’s the final PPC performance data from February (all of the data below is year-over-year):
Conversion Volume: +19% (YoY)
Paying Customers: +15% (YoY)
Customer Acquisition Cost: +32% (YoY)
Total Revenue Opportunity: -11% (YoY)
Closed Revenue: -16% (YoY)
33% of closed revenue did not convert via phone calls
Note that the February spend on PPC for the accounts in this sample decreased 17% month-over-month and increased 27% year-over-year and the March spend decreased 7% month-over-month and increased 28% year-over-year.
HVAC PPC Conversion Volume Decreased by 12% Month-Over-Month and Increased by 32% Year-Over-Year
Despite conversion volumes from PPC increasing year-over-year, they are down noticeably month-to-month.
Part of the fluctuations in conversion volume can be attributed to spend: month-over-month spend was down 7% (which correlates with fewer conversions), but year-over-year spend was up 28% (which correlates with increased conversions).
However, the overall trend from Q1 is that the total number of conversions from PPC for trades businesses in this sample was down 40% from January to March:

Month-over-month, unique leads were also down (14%), and booked jobs were down (11%).
However, a positive from this is that the match rate (how often unique leads matched to a net-new opportunity with revenue) was above 35%.
Our typical benchmark for a PPC match rate is 30%, so seeing that a higher percentage of these leads are turning into net new opportunities offsets the reduced conversion volume.
Paying Customers From PPC Decreased 22% Month-Over-Month and 12% Year-Over-Year
With the decline in conversions, unique leads, and booked customers, we also saw the number of paying customers decrease both month-over-month and year-over-year.
The number of paying customers (the number of unique customers who either have a sold or closed job) gets to the core of the revenue story for any particular period because it factors in how well leads book, match to new work, and convert to paying customers.
From January to March, the number of paying customers generated by PPC decreased by 36%:

One positive in this story is that average tickets increased 18% year-over-year, and 12% month-over-month.
So, despite fewer paying customers, those customers spent more on average, which can positively impact revenue generated.
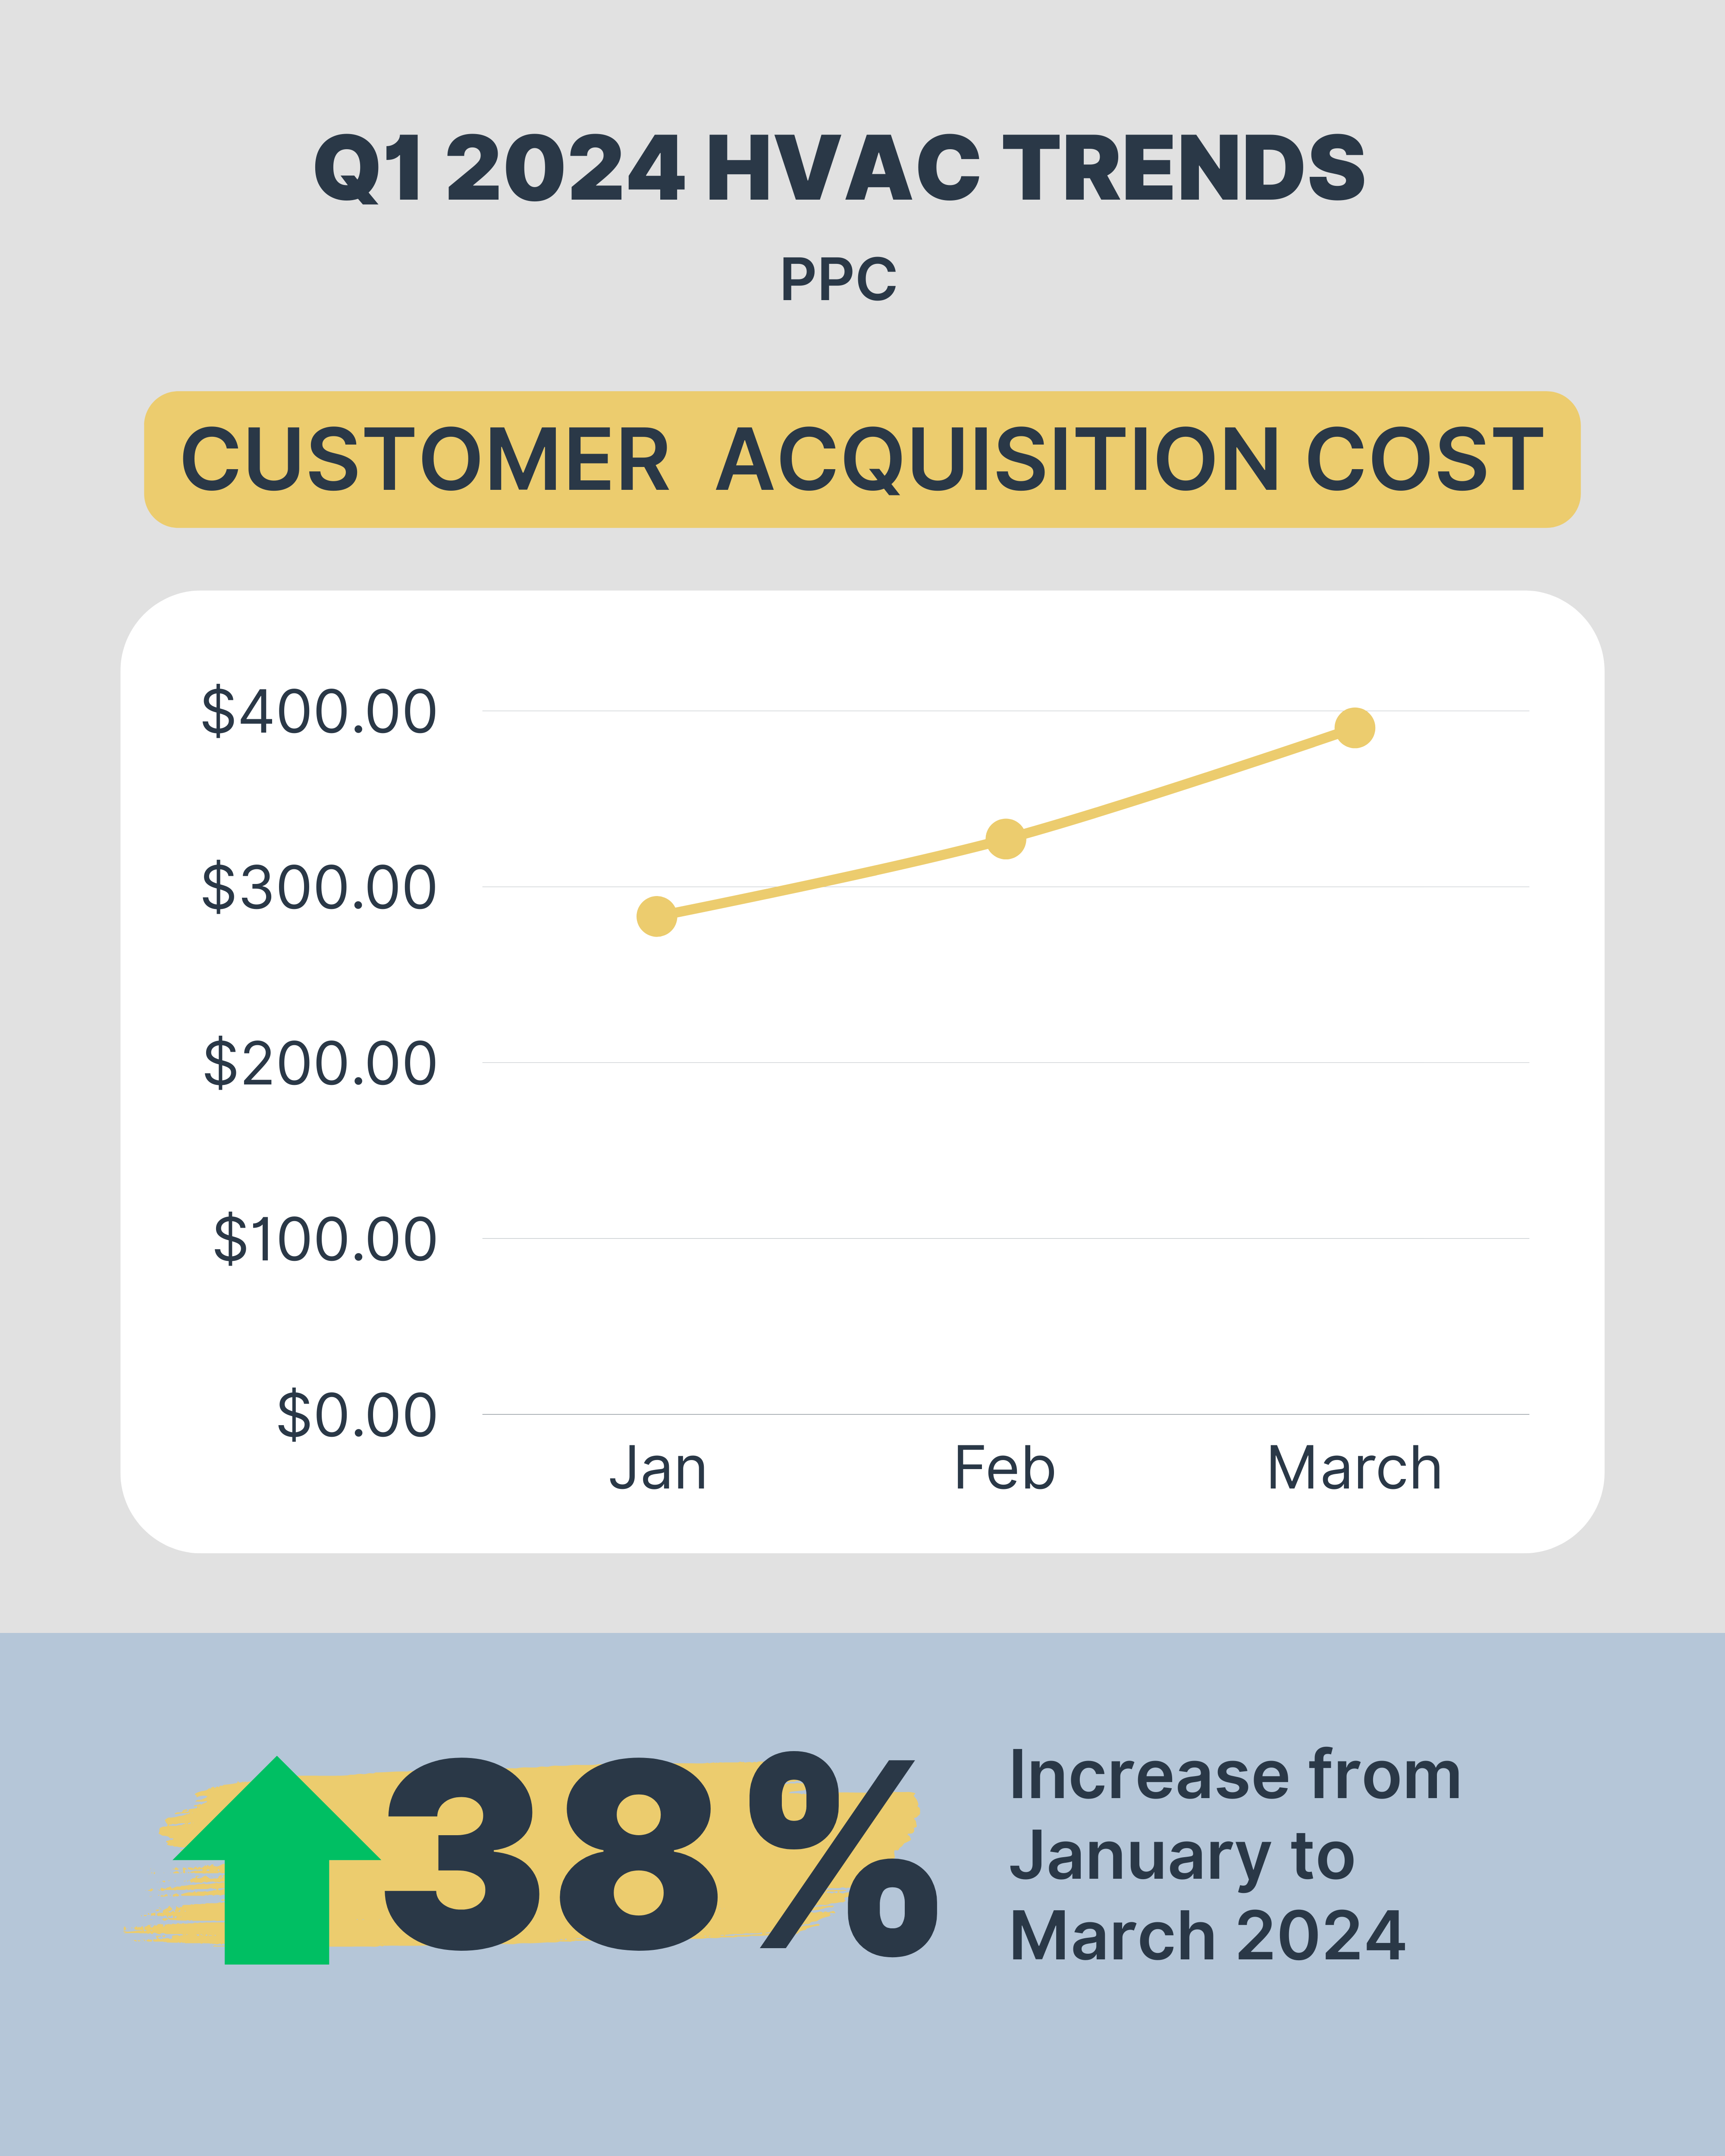
Customer Acquisition Cost Increased 24% Month-over-Month and Decreased 15% Year-Over-Year
From January to March, the cost to acquire a paying customer has noticeably risen by 38%.
Even though higher average tickets off-set some of this cost, this is a metric to keep an eye on in your business:
Since 2022, PPC customer acquisition costs have risen 28%, but have come down since 2023 (at least in March):

Paying customers are spending more on average, so an increased CAC isn’t necessarily the worst thing for your business, but tracking both of those metrics, including you ROAS, can ensure that you maintain profitability with rising costs.
Total PPC Revenue Opportunity Increased 8% Month-Over-Month and Increased 34% Year-Over-Year
Despite a downtrend in almost every single customer funnel KPI for PPC in March, revenue opportunity still increased 8% month-over-month.
How could that be, and what does it tell us about unlocking more opportunity even in a ‘down month’?
We already know that average tickets increased and that match rates were up slightly month-over-month, which means these businesses did more with fewer leads than in prior periods.
However, something else to consider is how much revenue is ‘stuck’ in unsold estimates.
In March, 55% of the total revenue opportunity was in unsold estimates.
Customers who receive an estimate will end up as matched in the SearchLight dashboard (or put another way, a run job), but they do not show up as paying customers because they haven’t yet committed to any work.
So, there will be scenarios when the number of paying customers declines, but the total revenue opportunity (the sum of unsold estimates, sold jobs, and closed jobs) increases.
If this happens in your business (total revenue opportunity increases, but the number of paying customers is down) it is important to revisit your re-hash and sales follow-up strategies and tactics, because you can likely increase paying customers and sold/closed revenue by concentrating on your unsold estimate audience.
This is especially true if more than 50% of your revenue is in unsold estimates!
34% of PPC Revenue Opportunity Did Not Convert via Phone Calls in March 2024
Last month, 33% of total revenue opportunities did not convert via phone calls, and this month we saw a slight upward trend, with 34% of total revenue opportunities converting via form leads, chat leads, and online scheduling.
In addition to that, 29% of closed revenue didn’t convert via phone calls.
That means 1 in 4 closed jobs from PPC converted via a form, chat, or online scheduling.
As you maximize the opportunity from PPC and other marketing channels within your business, it is recommended to make sure you have good lead handling processes for non phone call leads.
Closed Revenue Decreased 25% Month-Over-Month and Decreased 11% Year-Over-Year
Closed ROAS from PPC came in at a 4.7x on average across the business in this sample for March.
That means $1 in PPC spend brought in $4.70 in closed revenue.
While that is still profitable (we recommend shooting for at least a 4.5x closed ROAS), the total amount of closed revenue from PPC came down 25% from the prior month, and 11% from the prior year.
Since March 2022, closed ROAS from PPC has declined 38%:

While AHRI has not yet published any 2024 data outside of January, the above trend isn’t too surprising given the fact that from January 2022 to January 2024, US shipments of Central AC, Air-Source Heat Pumps and Warm Air Furnaces dropped by 34%:

We are seeing similar, if not worse demand levels than the great recession, but are hoping this is a bottom and we see a positive turn this summer.
Regardless of what’s out of your control, it’s critical to monitor key performance metrics for your marketing channels to make the most out of your available opportunity.
Until next time . . .
-Jon