👋 Hey, Jon here! Happy New Year - 2023 is done and we’re off to a data-filled 2024 :)
A special addition to this week’s newsletter will be 2023 trend lines for organic including customer acquisition cost and closed revenue so that you can see, by month, how organic trended. These have been some of my most popular posts on LinkedIn and I am excited for you all to have these benchmarks to compare against your performance.
Before we get into the data for December, I’ll give a recap of November’s organic performance, which showed a slight increase in customer acquisition costs but a noticeable rise in closed revenue to 24x:
Conversions: -7%
Average Ticket: +19%
Sold Revenue: -4%
Customer Acquisition Cost: $92.75
Closed Revenue: +32% (24x return on investment)
As usual, shout out to Josh Crouch and his team at Relentless Digital, who partnered with us to measure lead-to-revenue from their organic and LSA management services, enabling us to share these trends with you.
Organic Conversion Volume Decreased by 26% Month-Over-Month
Right off the bat, we see that conversions dropped substantially from November to December, a common trend across all marketing channels this time of year.
However, it’s not the end of the world, and here’s why:
Match rates in this period increased by 8%.
Paying customer rates in this period increased by over 20%.
Despite fewer conversions, more of them were turning into paid opportunities than in November, which contributed to a smaller drop off in closed revenue despite 26% fewer conversions.
This is a common trend - when conversion volume drops, match rates and paying customer rates tend to increase. There are fewer customers to handle and marketing/sales ops perform better. And vice-versa when conversion volume increases.
The key takeaway here is that lower conversion volume does not need to define your month. You and your team can offset some of the declines with strong lead-handling, sales, and follow-up processes.
It Cost $97.79 to Acquire a Paying Customer From Organic Channels in December
Customer acquisition costs from organic increased slightly but still stayed below $100.
Without a major weather change, December typically sees lower demand due to the holidays, but this year we did not see any major increase in the costs to acquire those customers.
Organic continues to be the lowest customer acquisition cost channel but after sharing this data on LinkedIn and Facebook recently, I got questions about how much of the revenue driven from organic is new vs. existing:
In December, 58% of closed revenue from organic channels came from new customers and 60% of the active customers in the month were new.
I’ll also note that 81% of closed revenue also came from the Google Business Profile / Google My Business.
While other channels like PPC do tend to drive a higher percentage of new customers, it’s worth noting that organic still drove a higher percentage of new customers than existing ones.
As far as 2023 trends go, Organic CAC was highest in January 2023, but trended down and bottomed in July. Since then, customer acquisition costs have risen slightly each month with December nearing the same CAC as March:
Average Tickets Decreased by 15% From The Prior Period
While average tickets did come down by 15% from November to December, there’s a little more behind this number:
The average tickets for new customers came down by 22% (this surprised me) and the average tickets for existing customers increased by 3%.
I’ve typically published one average ticket number, but it’s worth digging into new vs. existing customers when looking at your own data.
New customers typically have a higher average ticket than existing customers, but this month it flipped. This is not a usual trend, but as you think about specials, messaging, and content for your organic channels, knowing the value differences between existing and new customers can help craft that strategy.
I don’t expect the trend of new customer tickets dropping more than existing ones to continue but is something we’ll keep an eye on over the next few months.
Sold Revenue from Organic Leads Decreased 52% from the Prior Period
December tends to be a slow month, but as you start 2024, keep an eye on your pipeline with sold data.
A 52% drop is something I would closely monitor especially if conversion volume doesn’t pick up, because that means you’d be starting January with half of the revenue you started December with.
Another thing to note is that in December, 48% of the revenue potential was in unsold estimates.
Coming off of a holiday, an aggressive follow-up strategy to those more recent open estimates would be warranted, especially if your sales pipeline is down.
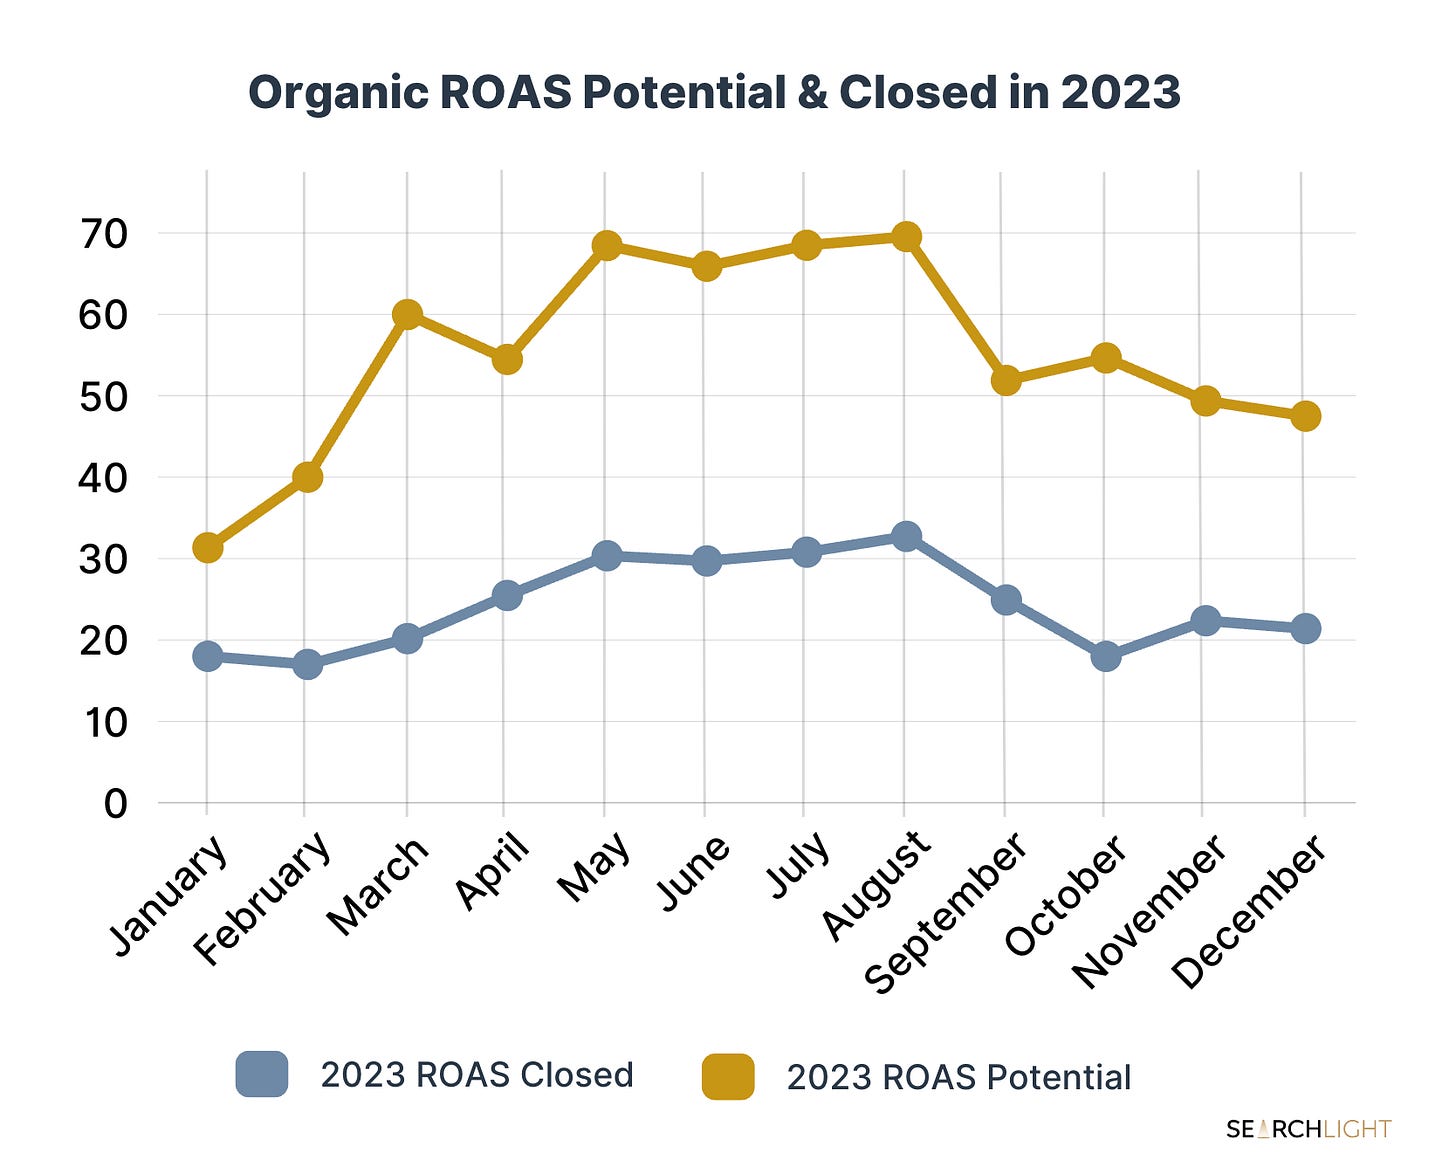
Closed Revenue from Organic Leads Decreased by 8% from the Prior Period to 21x ROI
Despite a 26% drop in conversion volume month-over-month, return on investment stayed above 20x and only decreased by 8%.
Lower average tickets didn’t help, but the fact that the paying customer rate increased by 20% helped December finish off strong.
For every $1 invested in organic, it returned $21, even during a down month!
I cannot emphasize enough that conversion volume will fluctuate in months - we all know the seasonality of our businesses. But don’t let this discourage or define what you think can be done.
Strong lead handling, follow-up, and sales processes can help your business make up the revenue.
In looking at the above graph, January and October were the two poorest performing months for organic with peak revenue generation in August. If there’s any takeaway from the above chart, it’s that January was 2023’s poorest-performing month, so make sure that sales operations are a point of emphasis this month, especially given the drop in the sales revenue pipeline!
Until next time . . .
-Jon


