HVAC Organic Demand Trends - February 2024
👋 Hey, Jon here! This week we are diving into Organic revenue performance from February 1st through February 26th.
Before we get into the data for February, I’ll give a recap of January’s organic performance, which showed a complete turn-around from December’s dip in performance. Conversions, average ticket, sold revenue and closed revenue all increased while customer acquisition cost came down nearly $18 month-over-month.
Conversions: +32%
Average Ticket: +10%
Sold Revenue: +136%
Customer Acquisition Cost: $80.09
Closed Revenue: +16% (25x return on investment)
As usual, shout out to Josh Crouch and his team at Relentless Digital, who partnered with us to measure lead-to-revenue from their organic and LSA management services, enabling us to share these trends with you.
Organic Conversion Volume Decreased by 31% Month-Over-Month
The burst in conversions experienced in January appears to have contracted in February, with a 31% decline in conversions and a 28% decline in active customers.
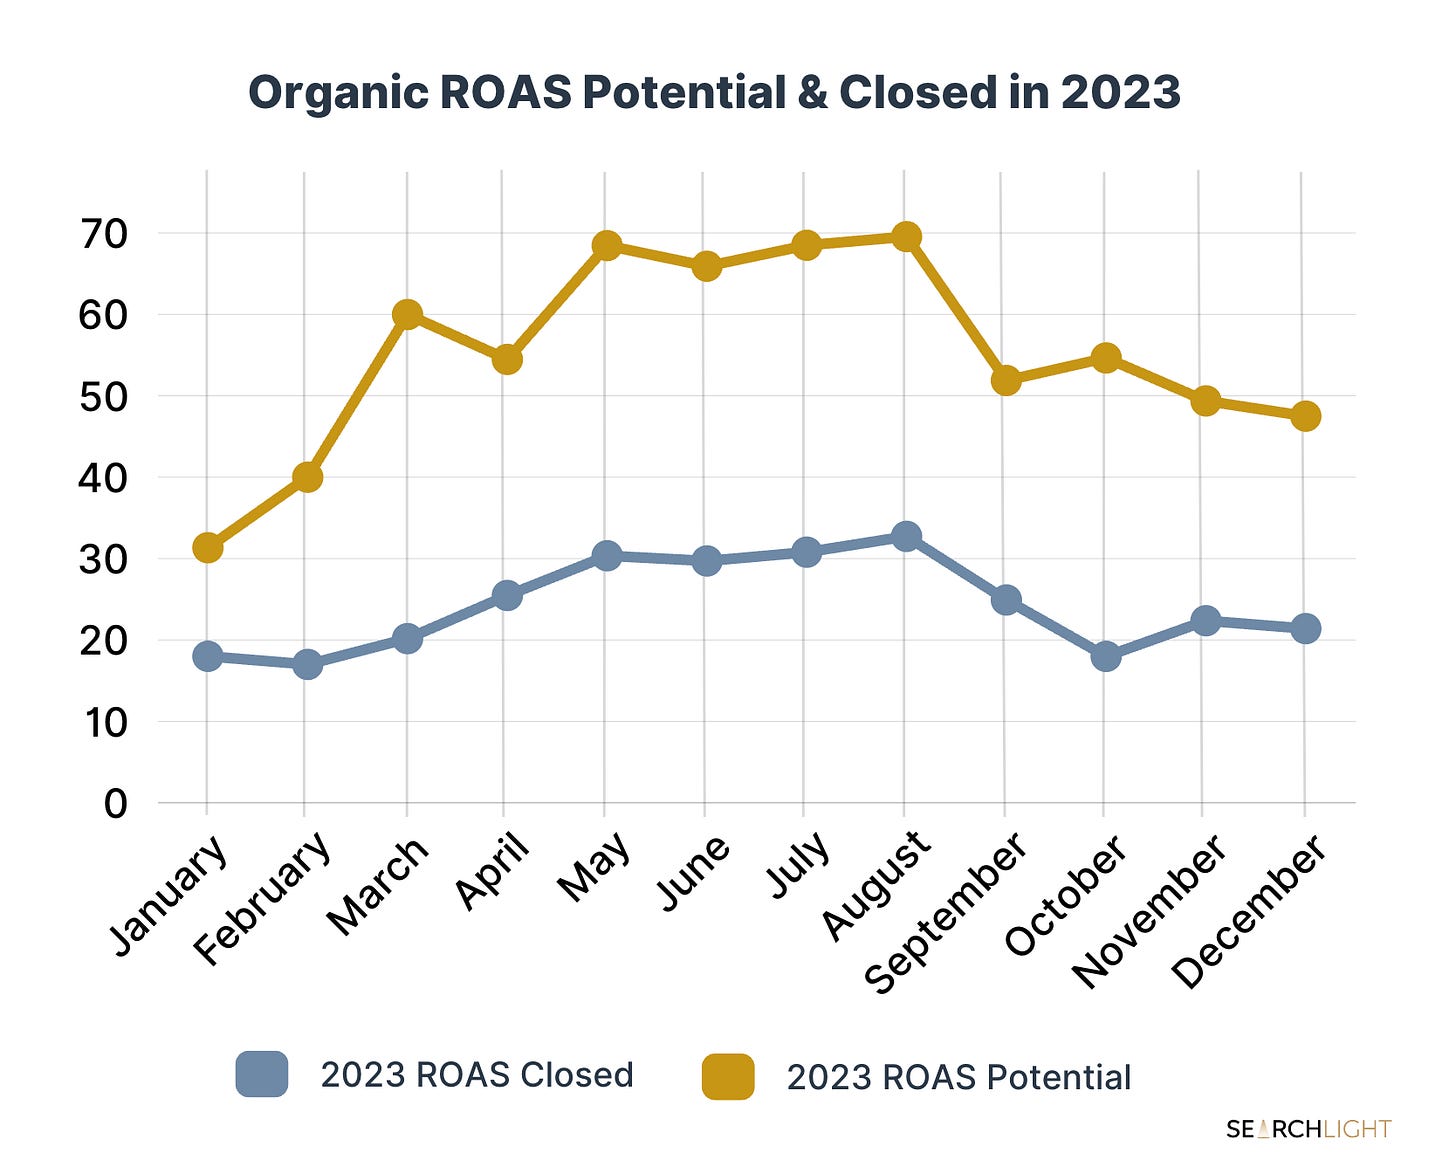
This isn’t entirely a surprise, as February was the worst performing month for organic channels (closed revenue) in 2023:
The ‘hot start’ of January seems to be short-lived. . . for now.
However, both match rate and paying customer rates increased (by 4% and 2% respectively).
This means that slightly more conversions turned into net-new revenue opportunities and paying customers, but the overall number of paying customers was still down 26% from the prior period.
It Cost $122.27 to Acquire a Paying Customer From Organic Channels in February
Despite the significant drop in conversions, active customers, and paying customers, it still only cost $122.27 to acquire a paying customer from organic (using management fees as the cost basis).
While this is a 50% increase from the prior period, it is still significantly less expensive than other paid channels.
For example, the customer acquisition cost for Google Local Service Ads in January was $402.
However, year-over-year, customer acquisition costs are up by $22:
It’s unlikely that this trend (rising CACs) will continue throughout 2024, given that February was unseasonably warm in many areas of the US, but it is something we will keep an eye on!
Average Tickets Increased by 4% From The Prior Period
A bright spot for February is that average tickets increased by 4% to just over $2,700 with 72% of closed revenue coming from new customers.
New customers had an average ticket of over $2,900.
Also keep in mind that 44% of closed revenue came from service jobs, with a lower average ticket of just $1,800.
Sold Revenue from Organic Leads Decreased 60% from the Prior Period
The decrease in conversions, active customers, and paying customers was felt through sold and closed revenue.
Despite the slight increase in average tickets, it wasn’t enough to make up for the drop in the volume of demand.
Sold revenue decreased a whopping 60%, which is likely to impact March with less revenue volume in the pipeline.
However, the return on investment potential was still above 48x ($1 spent generated $48 in revenue opportunity) so there’s more to this story:
54% of revenue opportunity is in the unsold estimate category.
We never want to see this number higher than 50%, as it means revenue opportunity was left on the table.
If the brands in this sample were able to close 4% more of those unsold estimates, it would have generated an additional 1x ROI closed - small percentage improvements add up to real dollars for your bottom line!
Closed Revenue from Organic Leads Decreased by 18% from the Prior Period to 19x ROI
For every $1 spent on SEO management fees, $19 of closed revenue was generated in return.
Yes, that was a decrease of 18% from the prior period, but getting $19 in return for every $1 spent in a bad month is still very profitable.
Total closed revenue also only dropped 10% from the prior period, much less than would be expected with a 31% drop in conversions.
As a final note, I’ll leave you with two more stats to provide insight into organic performance:
81% of closed revenue came from Google My Business
22% of revenue opportunity converted via form, chat, and online scheduling
Google My Business profiles continue to convert the majority of organic revenue so as you think about allocating resources to various organic channels, GMB would be at the top of my list.
Regarding the way customers are converting, things have been pretty steady with an 80/20 split between phone calls and forms, chats, and online scheduling.
But again, this is something we’ll want to keep an eye on throughout the year.
Until next time . . .
-Jon


