


Measuring Revenue Flow from Reach to Sold Job: Facebook Edition

This week, we are unveiling our first deep dive into revenue flow for paid Facebook ads!
Before we dive in, below are key points to understand about this data:
Facebook is a Demand Generation / Creation channel - it differs from Google + Bing PPC in that someone isn’t raising their hand to say they want a product / service you offer. They are browsing Facebook, and you “interrupt” them with compelling visual/video creative in hopes to get them to stop, click, and convert on your website
This analysis is not based on view through attribution - these are based on leads that came directly from a click to a Facebook ad leveraging our revenue tracking technology
View-through attribution is based on people who saw your ads, but didn’t necessarily click on them, and did business with you in a specified time period after seeing the ad. Facebook adjusted the view-through window from 30-days to 7 days and 1 day (depending on specific scenarios), severely limiting view-through attribution effectiveness in home services
Facebook ad goals can vary widely across contractors - some more focused on branding, others more focused on selling - the campaigns in this analysis are a mix of both
We’ve been using our revenue attribution platform to track lead to revenue from Facebook for about 2 years, and the results are mixed - some brands do very well to generate revenue, but others struggle to generate any revenue at all (even across multiple agencies)
This data is based on a dozen HVAC contractor’s performance from January - September 2022
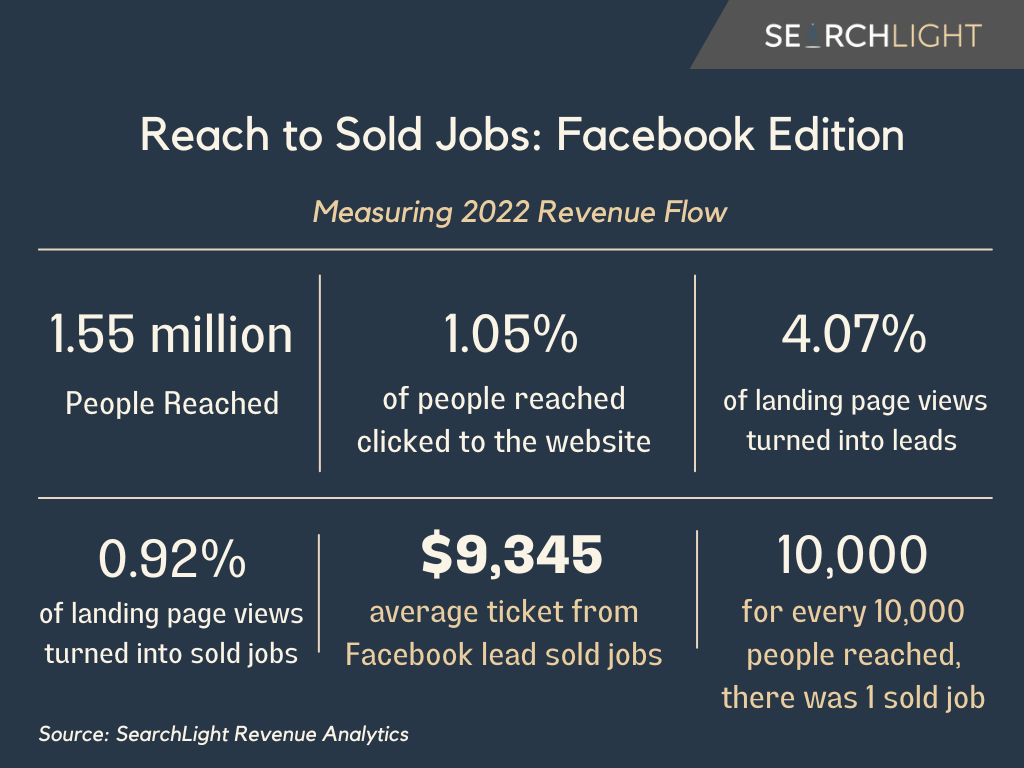
1.05% Of People Who Saw a Facebook Ad Clicked Through to a Landing Page
Facebook offers a number of metrics to track performance, but I focus on reach and landing page views as our core high-level metrics in this newsletter.
Reach is a more useful KPI in this analysis because we want to look at the revenue flow progression percentages based on unique individuals exposed to these ads.
In the future, I will do similar analysis based on impressions, but I’ll share frequency (the number of times a customer saw an ad) correlations to revenue generation from Facebook.
We tracked 1.55 million people who saw a paid Facebook ad (defined as reach) and about 1 in 100 of those people reached ended up on the landing page associated with that Facebook campaign.
Note that in this performance study, it cost $0.14 to reach 1 individual through paid Facebook ads, meaning it cost $13.65 to get a landing page view.
Remember, performance will vary greatly depending on the types of campaigns you run, but now you have a reference that in this specific study, it cost $13.65 to get someone from a Facebook ad to an HVAC website.
4.07% of Landing Page Views From Paid Facebook Ads Converted to A Lead
A customer leaving Facebook to go to your website is the first major hurdle of generating revenue with Facebook ads.
You could argue that Facebook Lead Ads (form included right in that ad) remove that step and in theory would make it easier to convert customers, but we’ve been tracking revenue data for 2 years and have yet to see that work effectively.
Once someone is on your website, the hope is that they convert and give you an opportunity to earn their business.
Out of the leads we tracked from paid Facebook ads, 42% ended up matching to a new opportunity in the CRM.
So, if you can convince someone to leave Facebook to go to your website with one of your ads and that person submits a lead, 42 out of 100 times that customer will end up in your CRM with a sellable opportunity!
How Do Facebook Paid Ad Leads Convert on HVAC Websites?
Before we dive into the percentage of landing page visits from paid Facebook ads that convert to sold jobs, let’s take a look at how those leads converted on the website:
48% of leads converted via Form
21% of leads converted via Phone
20% of leads converted via Chat
11% of leads converted via Online Scheduling
Note: not all websites in this sample had form, phone, chat and online scheduling on their websites, so the data is skewed and isn’t a true benchmark.
While the data is slightly skewed due to not all contractors using online scheduling and chat in this sample, it’s telling that 48% of Facebook leads converted via Form, especially because nearly 80% of PPC leads convert via phone call.
Now let’s look at which conversion tools drove the most closed revenue from Facebook leads:
Form: 37% of closed revenue
Chat: 24% of closed revenue
Phone: 20% of closed revenue
Online Scheduling: 19% of closed revenue
Form and chat accounted for 61% of closed revenue from paid Facebook leads.
Your first takeaway here is that if you are running paid Facebook ads, make sure your landing pages have forms and chat on them!
You should also consider adding online scheduling, as it accounted for 19% of closed revenue despite not all of the accounts in this sample using the tool.
0.92% of Landing Page Views from Paid Facebook Ads Converted to A Sold Job
Just under 1% of people who click a Facebook ad and land on your website end up as a paying customer.
This means, based on the sample in this study, that you would need to reach 10,000 individuals on Facebook per 1 sold job.
Again, this could vary widely depending on how you advertise on Facebook, budget, services offered, audiences used, etc. but this is a fascinating insight.
I’ll also save you from doing the math, it cost about $1,500 to get a paid job from a Facebook ad, but the average ticket of those jobs was $9,345!
That is a return on ad spend of 6.23x or earning $6.23 for every $1 spent on Facebook ads.
Closing Thoughts + Bonus FAQ
Because Facebook is a demand generation channel, I don’t focus as heavily on ROAS when evaluating performance as I would PPC, GLSAs, SEO, etc.
What’s best for your business could be a pure branding campaign that doesn’t drive clicks from Facebook, but rather keeps you top of mind before someone heads to Google or Bing to punch in a “furnace installation near me”.
That’s why I didn’t lead with ROAS from this analysis, because I don’t recommend that you fixate on that and let it limit your creativity.
As a follow-on to that, you may be wondering the ideal number of times a customer needs to view an ad (frequency) to generate the most revenue.
The top performing accounts in this study had a median frequency of 10.5 versus 6.47 for the rest of the accounts in the study.
This does suggest aiming for a frequency of around 10 to maximize performance and awareness of ads, but again, this will vary based on your goals, messaging, brand recognition, budget available, etc.
Later this week, I’ll go deeper into how Facebook leads converted on the website and will include match rate, booked jobs rates, average tickets and more!
Until next time,
Jon