SEO Edition HVAC Lead Trends: Day of the Week Performance Analysis
👋 Hey, Jon here, in this newsletter we’re going to revisit a topic I’ve been nerding out on lately: analyzing leads and revenue by day.
The last time I wrote about this topic, I looked specifically at PPC and paid Facebook leads, but this time around, we’re looking at organic leads to answer the following questions:
What day are people most likely to contact your business via organic channels?
Which day of the week produced the most booked jobs (sold/closed jobs) from organic leads?
What is the booked job rate (% of leads that turn into sold / closed jobs) for organic leads by day?
What is the average ticket for organic leads by day?
Which day of the week produced the highest revenue from organic leads?
Note: ~3,000 organic HVAC leads from May 2022 - December 2022 were used in this sample.
PS - Be sure to catch my webinar, How to Convert More Customers in 2023 with Schedule Engine and Service Titan on Thursday, February 2nd at 1 pm EST / 10 am PST. I’ll have lots of good data, benchmarks and insights from 2022 that can help you succeed in 2023. Here’s the link to register.
Let’s dive in!
Tuesdays Had The Highest Volume of Organic Lead Submissions
If you remember, PPC and Facebook lead volume was highest on Mondays, followed by Tuesday.
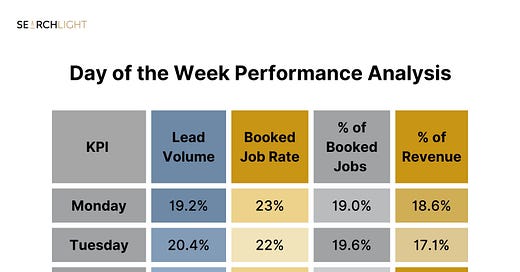
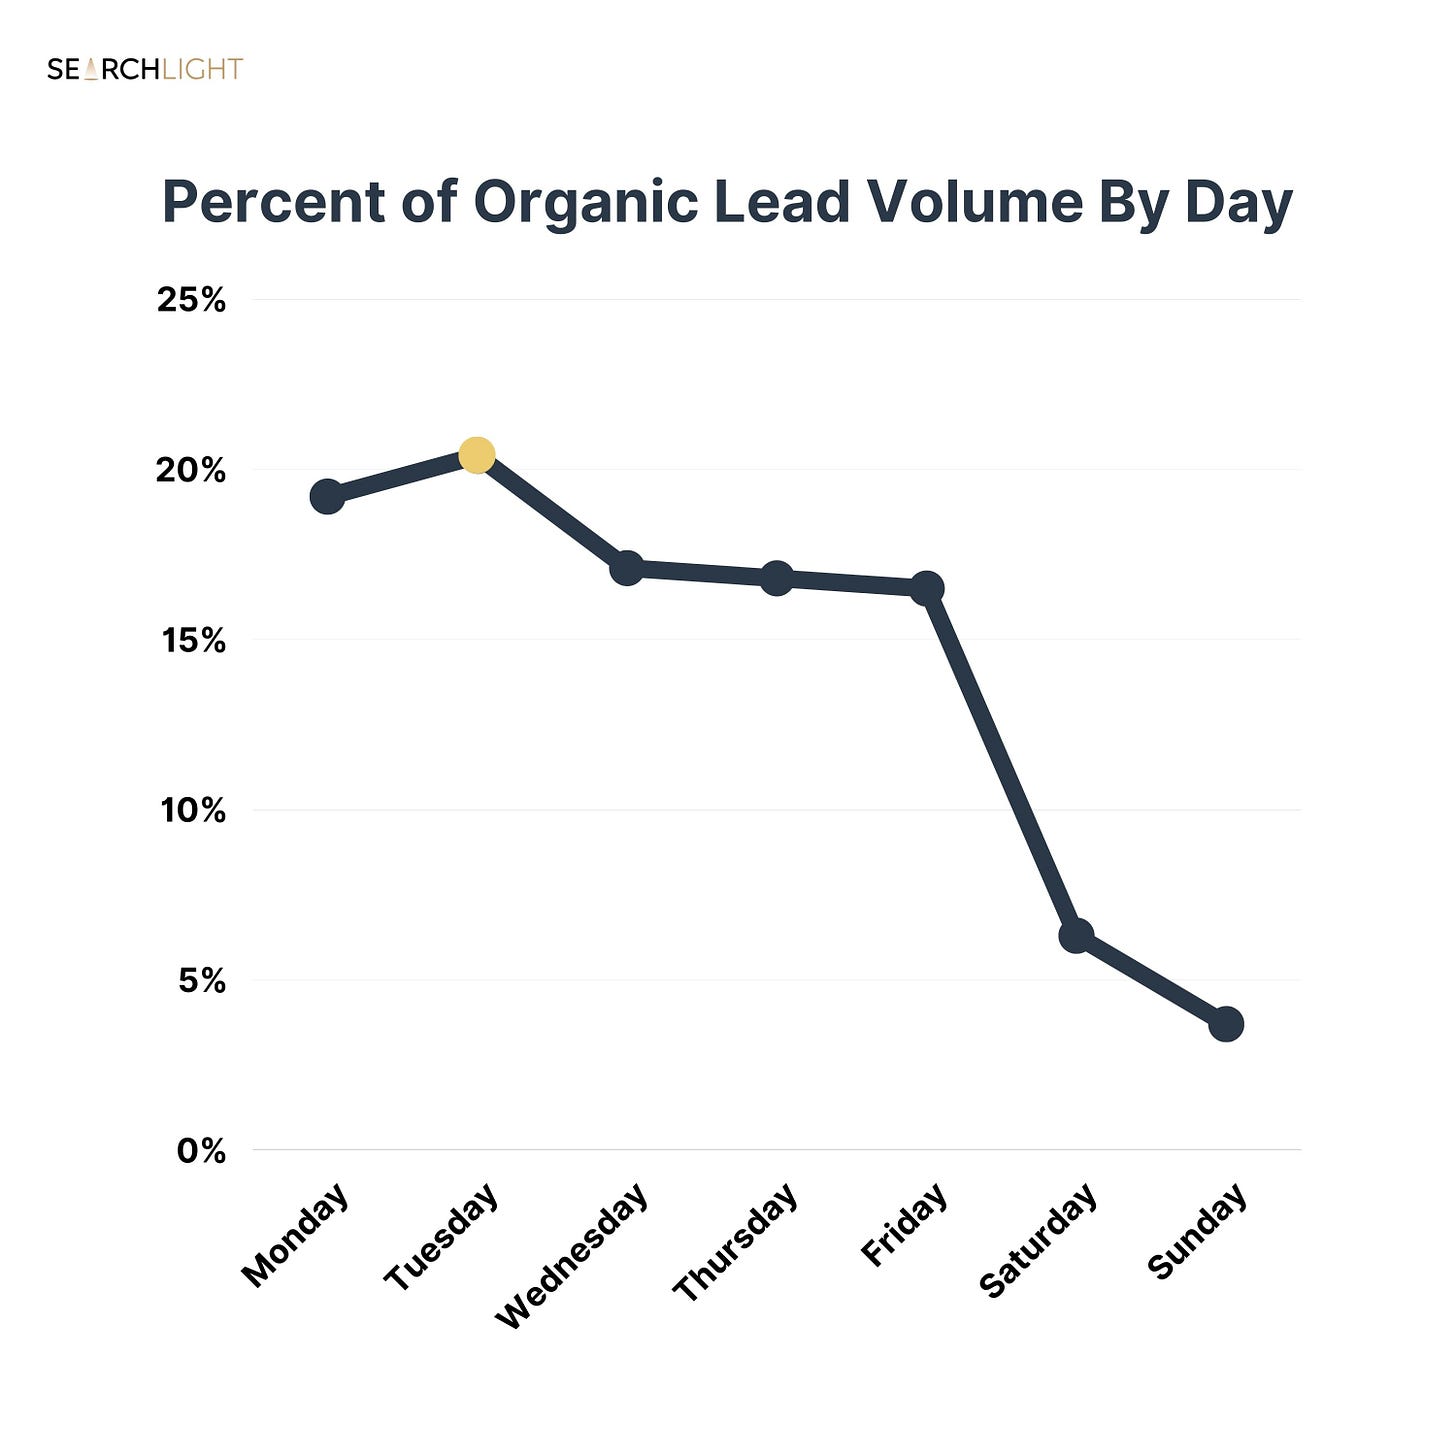
But for organic leads, Tuesday takes the top spot with 20.4% of organic leads converting on that day.
Monday was a close second with 19.2% of overall organic lead volume converted.
Here’s the full breakdown of organic lead submission by day of the week for this sample:
Monday - 19.2%
Tuesday - 20.4%
Wednesday - 17.1%
Thursday - 16.8%
Friday - 16.5%
Saturday - 6.3%
Sunday - 3.7%
More than 56% of organic leads came in the first 3 days of the week.
Organic Leads That Converted on Tuesday Produced the Most Booked Jobs
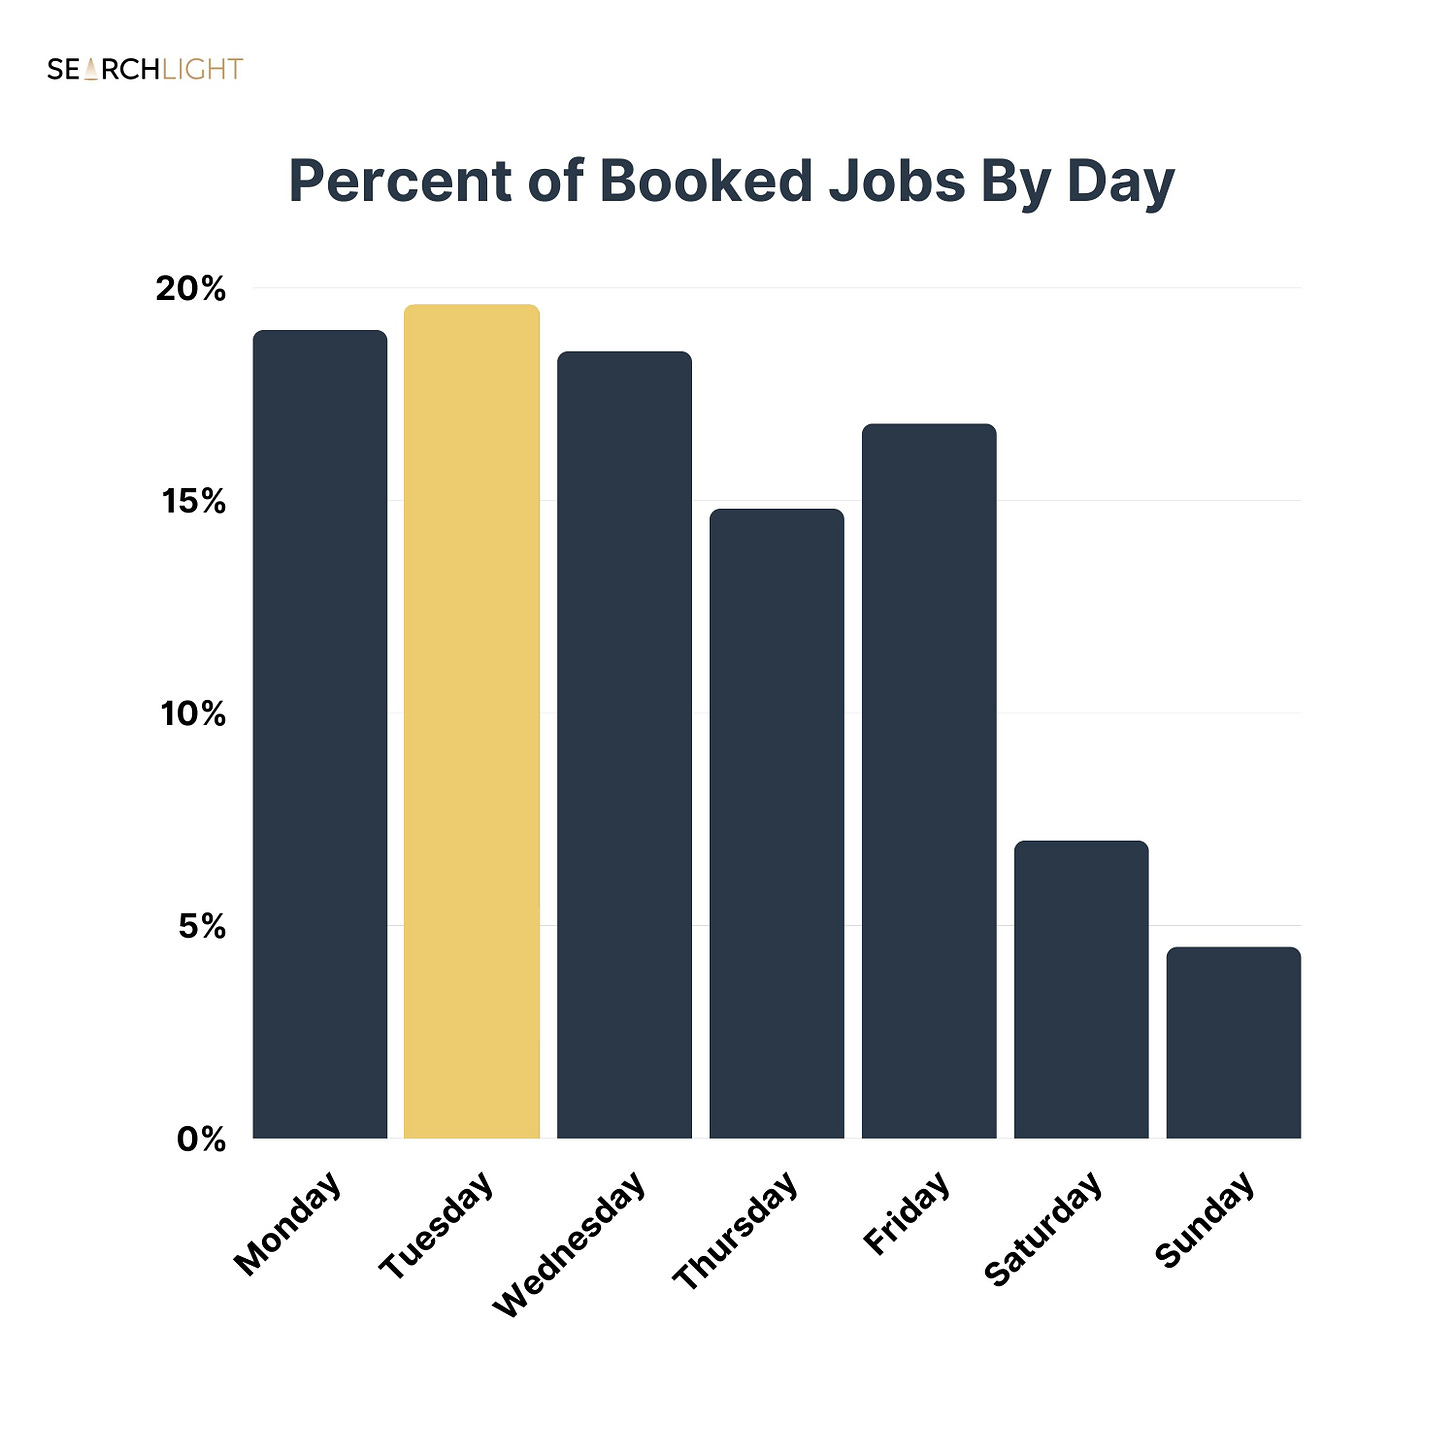
As expected, the day of the week with the highest organic lead volume also produced the highest number of booked jobs, but Monday was a close second.
Here’s how the full week breaks down:
19.0% of booked jobs came in on a Monday
19.6% of booked jobs came in on a Tuesday
18.3% of booked jobs came in on a Wednesday
14.8% of booked jobs came in on a Thursday
16.8% of booked jobs came in on a Friday
7% of booked jobs came in on a Saturday
4.5% of booked jobs came in on a Sunday
Next, we’ll want to look at how well leads converted into a sold/closed job with booked job rate by day.
Organic Leads That Converted on Sunday Had The Highest Booked Job Rate
Lead volume doesn’t mean anything if those leads aren’t turning into work for your business.
And interestingly enough, organic leads that converted on a Sunday had the highest booked job rate at 27%.
This means that 27 of every 100 leads that converted on a Sunday turned into a paying customer.
Here’s how it breaks out for the full week:
23% of organic leads that converted on a Monday turned into a sold / closed job
22% of organic leads that converted on a Tuesday turned into a sold / closed job
24% of organic leads that converted on a Wednesday turned into a sold / closed job
20% of organic leads that converted on a Thursday turned into a sold / closed job
23% of organic leads that converted on a Friday turned into a sold / closed job
25% of organic leads that converted on a Saturday turned into a sold / closed job
27% of organic leads that converted on a Sunday turned into a sold / closed job
Organic leads that converted on a Thursday had the lowest booked job rate at 20%, and the next lowest was Tuesday, when the highest lead volume came in.
1-2% might not seem like a big difference, but for every 100 leads, that’s 1-2 fewer booked jobs and depending on your average ticket, that can add up fast.
So, let’s take a look at average tickets next.
Organic Leads That Converted on a Sunday Had The Highest Average Ticket
Average ticket can influence generated revenue, efficiency of that revenue and ensure your customer acquisition costs are keeping your business profitable.
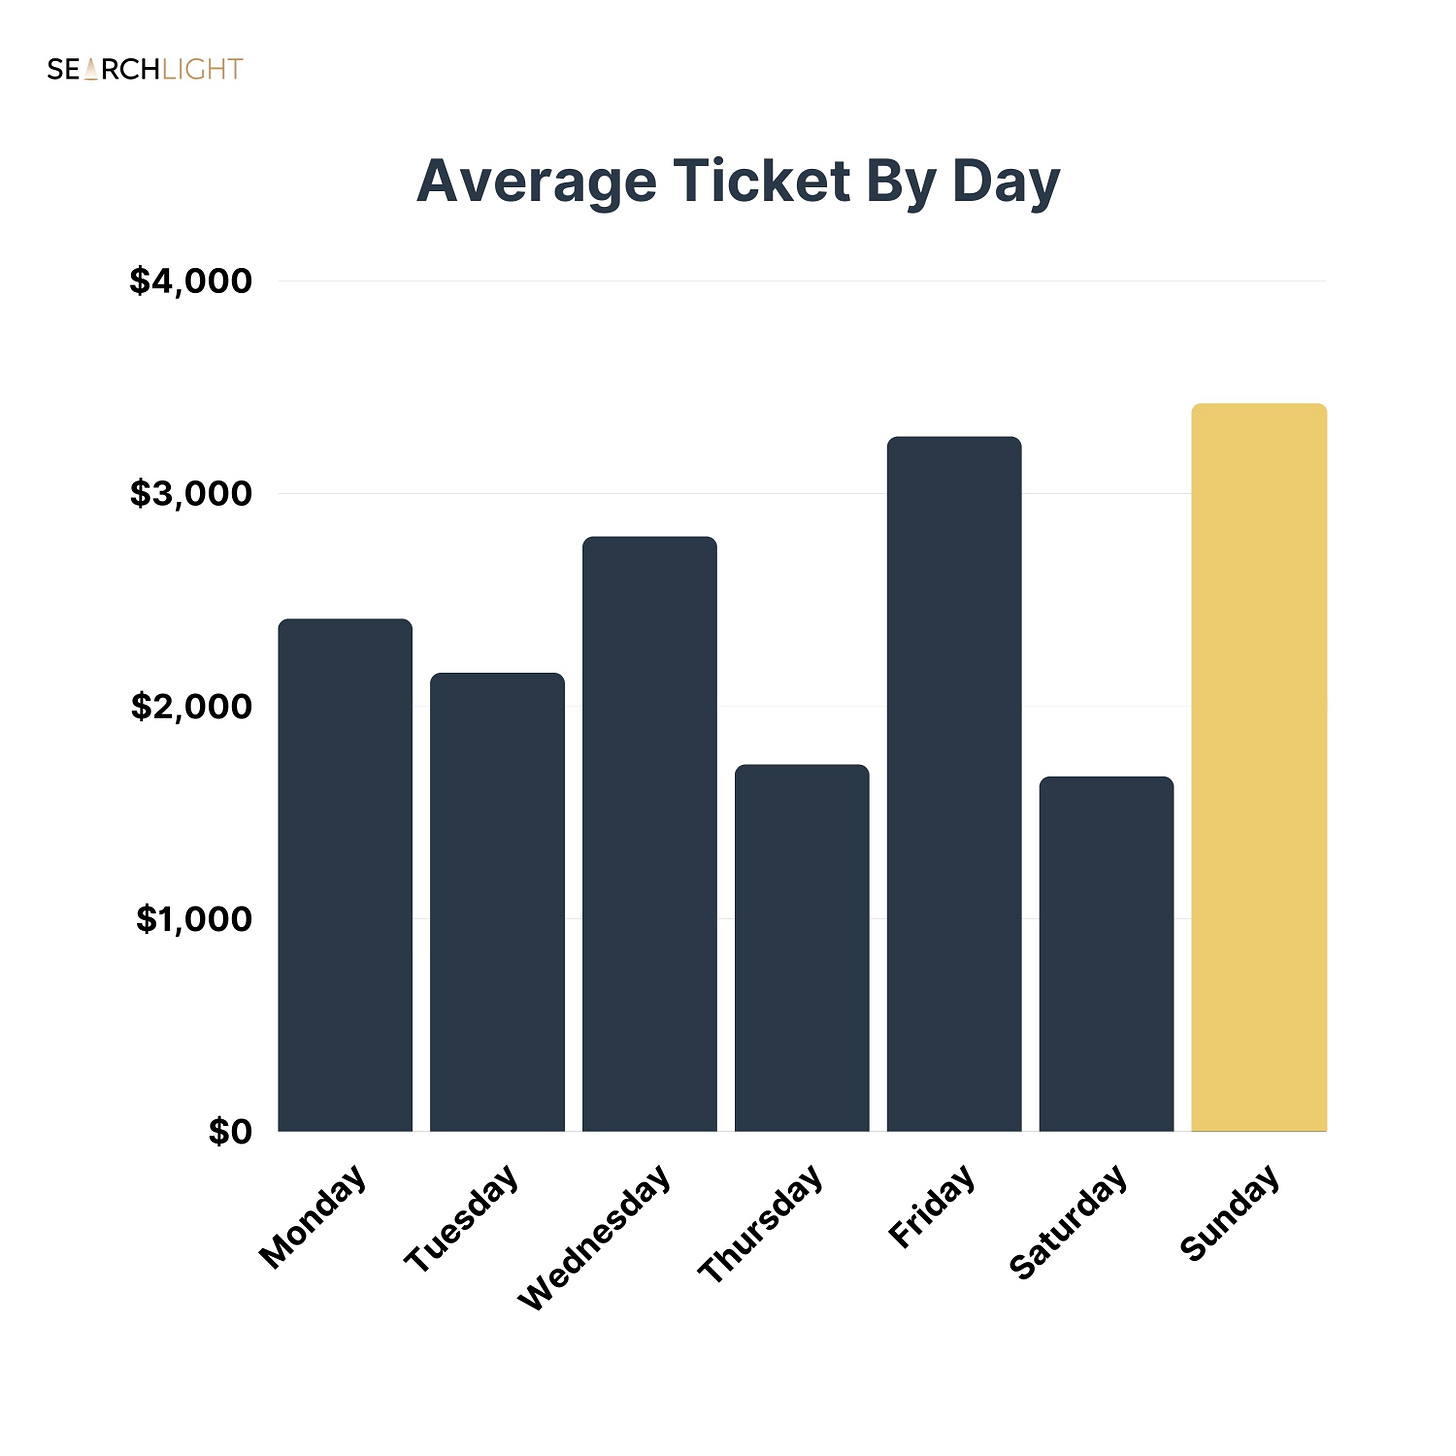
Sunday had both the lowest lead volume and booked jobs by day, but at an average ticket of $3,419, customers that converted on a Sunday spent the most money.
Here’s the full week, ranked by highest average ticket to lowest average ticket:
(1) Sunday - $3,419
(2) Friday - $3,267
(3) Wednesday - $2,797
(4) Monday - $2,410
(5) Tuesday - $2,156
(6) Thursday - $1,725
(7) Saturday - $1,669
Finally, we will look at sold/closed revenue by day of week to tie the full picture together.
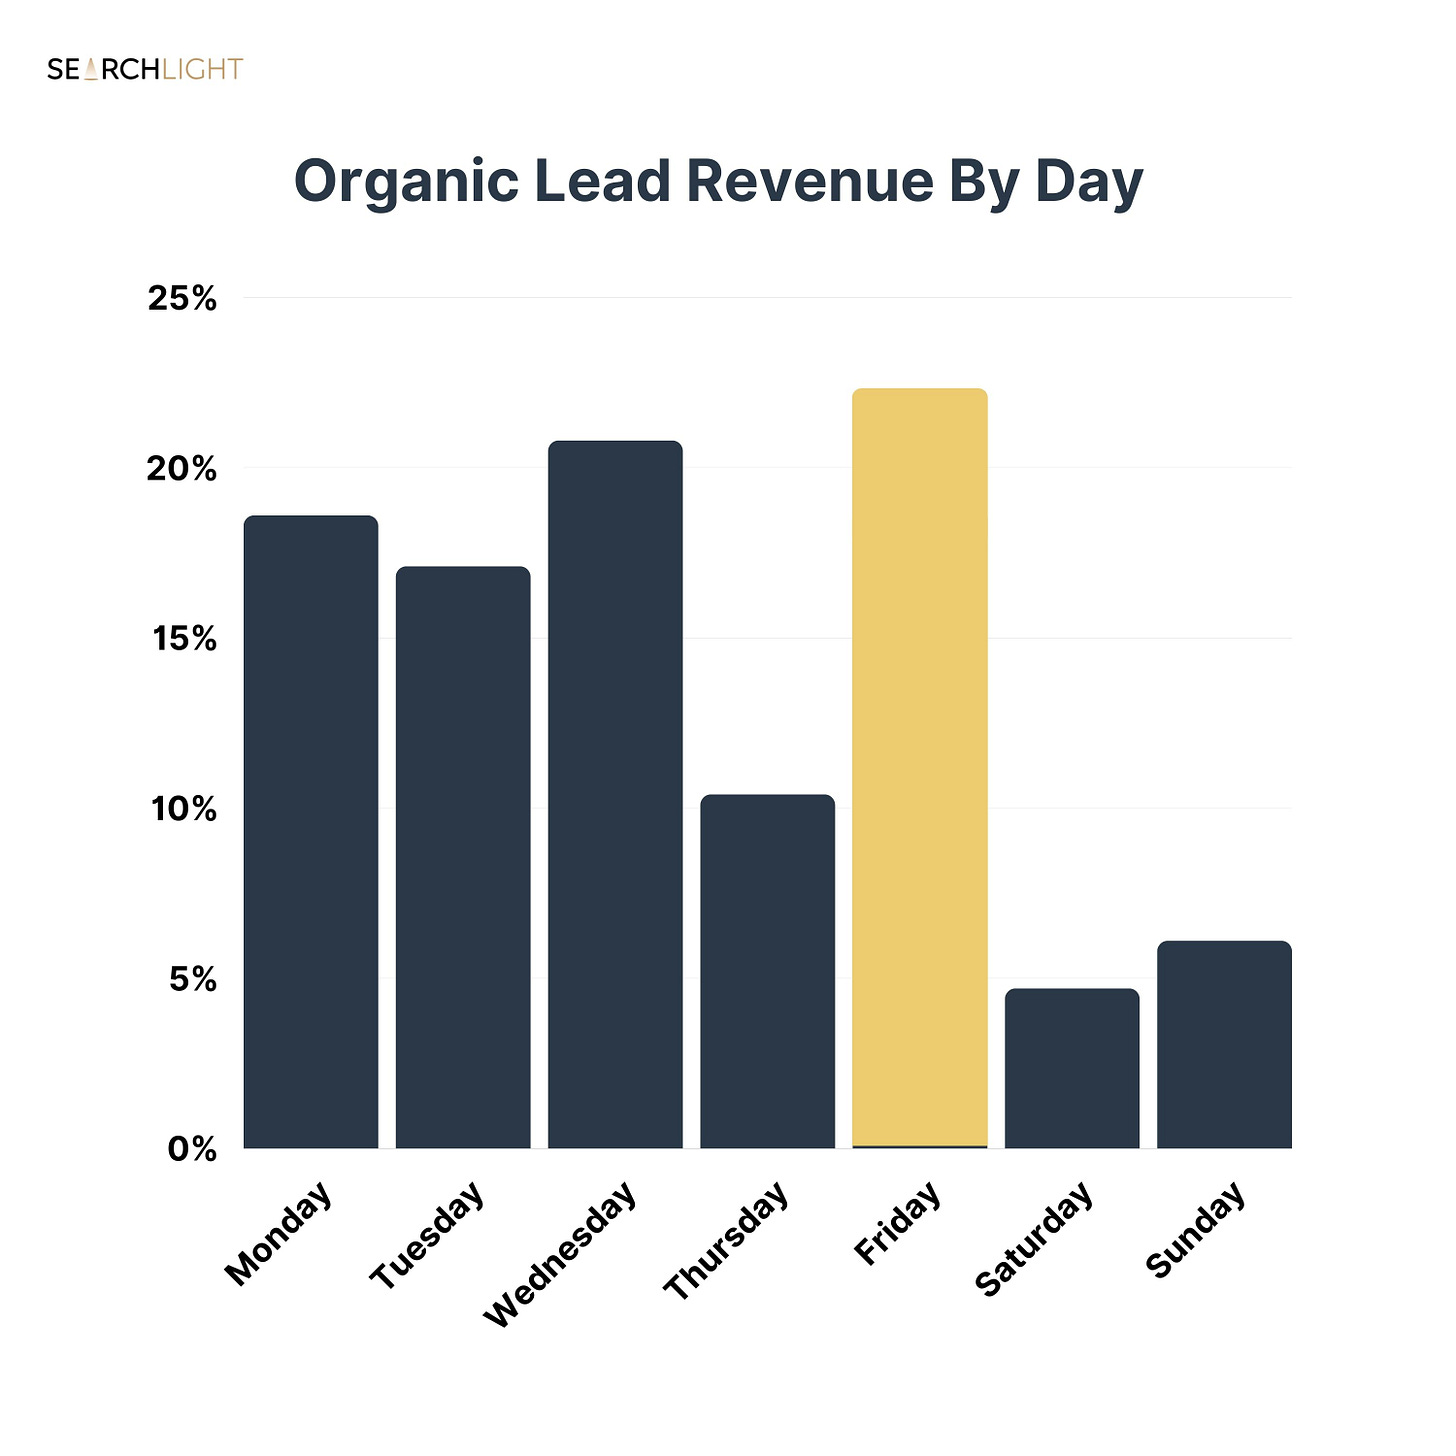
Organic Leads That Converted on Fridays Produced the Most Revenue
22.3% of all sold/closed revenue for the HVAC businesses in this sample came from leads that converted on a Friday.
Friday ranked 5th in lead volume, 4th in booked job volume, 3rd in booked job rate but 2nd in average ticket (over $1,000 higher than Tuesday) which ultimately led to higher revenue production than all other days of the week.
This illustrates the importance of looking at the entire revenue flow journey.
Below is the percent of the total revenue based on the day that lead converted:
(1) Friday - 22.3%
(2) Wednesday - 20.8%
(3) Monday - 18.6%
(4) Tuesday - 17.1%
(5) Thursday - 10.4%
(6) Sunday - 6.1%
(7) Saturday - 4.7%
Tuesday drove the highest lead volume, but ranked 4th in revenue produced.
Closing Thoughts
Whenever I look at data like this, I think about two things and I encourage you to do the same:
(1) How will this data influence the way I operate my business?
(2) How have I influenced this data based on the I’m operating my business?
For example, organic lead volumes are low on Saturday and Sunday.
If you are closed on weekends, and your Google My Business / Google Business Profile reflect that, it’s not surprising to see a lower organic lead volume on those days.
However, if you change the way you operate, and decide to offer Saturday hours, you would then have a benchmark to compare against and see if and by how much organic lead volume increased.
Then, by looking at booked job rate, average ticket and ultimately, revenue, you can see how much revenue volume changes (if at all) when you make this business decision.
Let’s look at another example of how you can use this data:
If you (or your vendor) posts organic content every Tuesday, and that’s when lead volume is highest, consider adding a second day that you continually post organic content.
Use the benchmarks to determine if those efforts impacted lead volume and ultimately revenue.
As a business owner, you are charged with making decision after decision for your business, but without good data, I continually hear it is overwhelming.
There are so many little decision points (even the organic content example - should you hire someone to post more, allocate more resources internally to do it, or invest any more time or resources at all?) that data like this can help you measure the business outcome to continually refine marketing and operations.
Until next time . . .
-Jon
PS - Go Birds!

