Analyzing October HVAC Demand Trends
👋 Hey, Jon here! Each month, we publish PPC + Facebook performance trends for an anonymized sample of HVAC contractors from across the US that use our revenue flow analytics platform. In this newsletter, I compare October performance to September performance. With unusually warm weather this fall, I’m excited to share demand patterns as we (hopefully) head into some colder weather. Let’s dive in!
Fortunately, October brought in noticeably more demand than September (as I’m sure many of you expected), but given the extended warmer weather in most areas with macroeconomic indicators, we weren’t so sure what to expect.
Let’s have a look:
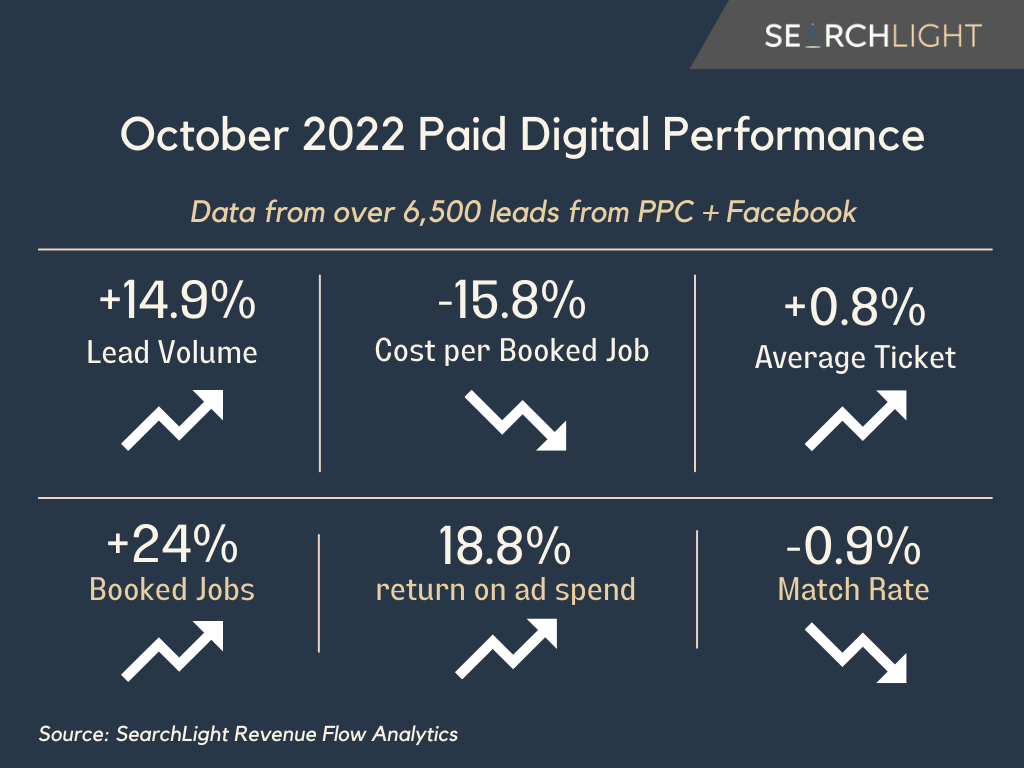
Lead Volume: ⬆️ 14.9%
Cost per Booked Job: ⬇️ 15.8%
Average Ticket: ⬆️ 0.8%
Booked Job Rate: ⬆️ 1.7%
Match Rate: ⬇️ .9%
Return on Ad Spend: ⬆️ - 18.8%
Lead volume increased for the second consecutive month (8% decrease in August, 9% increase in September, nearly 15% increase in October) and the average cost per booked job decreased by 15.8%.
The key difference between September and October is that despite rising lead volumes in both months, it was less expensive to get a paying customer from PPC + Facebook in October than it was in September.
Average tickets increased only slightly (0.8%) but I will dive into install job trends from September to October in the next section.
Because booked job rates (the percentage of leads that turn into a sold or closed jobs) increased by 1.7% and lead volumes were up, return on ad spend (of sold and closed jobs) increased by 18.8% from September to October.
Lead handling performance (how well leads are responded to and converted, measured by match rate and booked job rate) remained consistent, and is something to consider if your lead volumes were up but your revenue was unchanged or decreased.
It is still so important to make sure, especially if you have multiple conversion tools on your website, that you have good lead response processes and standards for your team members. No matter how many more leads you get, if they aren’t being responded to in a timely manner with accurate information, we have seen through our analytics that it has a negative effect on revenue.
Installation Revenue (Closed) Increased 27% in October
Another positive trend the October data showed is that the number of installation leads increased 15.5% from September to October, and the average tickets of those installations increased by 2%.
The number of installation booked jobs also increased by 22%.
While installs accounted for 81% of total October revenue (compared to 84% in September), revenue from completed installations increased 27% from September to October.
The sneaky takeaway that explains some of this increase is the fact that the booked job rate for install leads increased by 7% from September to October.
In September, average tickets dropped 13% and the takeaway was that it was harder to close customers, so discounts and deals were introduced in an effort to create urgency.
Average tickets creeped up by about 2% in October, so more customers closed without needing further discounts, suggesting a higher quality of demand.
70% of Install Leads Converted via Phone Calls in October
In my final insight from October data, I went a level deeper on analyzing conversion tool performance by looking only at install leads.
In the past, I’ve reported on match rate, booked job rate, closed revenue, etc. for conversion tools looking at all business units (service and install) but in this case I think it’s useful to look at how customers who wanted installations converted on HVAC websites from paid advertising.
One way to interpret this data is that the majority of people who wanted to replace their equipment (from this sample data) chose to call and set-up the appointment over the phone.
Another way to look at this data is that 30% of install leads did not convert via Phone Calls, but through other tools:
📱Phone - 70%
📅 Online Scheduling - 12%
📝 Form - 10%
⌨️ Chat - 8%
To my point earlier, if you are looking to maximize revenue and your return on ad spend, especially from new installs, keep in mind that this sample shows that 30% of those leads converted from online scheduling, forms and chats.
It’s always worth revisiting your team’s process for monitoring and responding to those leads.
To drive this point home, the average ticket of a converted install lead from forms was $9,320 (compared to $6,811 from phone) and the average ticket of chat converted install leads was $7,547.
Closing Thoughts
You’ll get a deeper dive of conversion tool performance filtered by installation business units in the next newsletter, but overall October trended in a positive direction, which is great news!
One thing I’m keeping a close eye on in November 👀 is average tickets. September and October brought on discounting to close more customers during a period of lighter demand, so I’m eager to see if that increases in November without a reduction in booked job rate.
Until next time . . .
Jon
PS - I hope you all have a wonderful week + thank you SO much for reading.


