


HVAC Demand Trends: Google LSA Revenue Performance - January 2025


👋 Hey, Jon here! This week, we’re reviewing Google LSA performance for January. This data set required a minimum spend of $1,000 / mo on GLSA, so while averages can be helpful, there’s a big range of performance. The lowest closed ROAS in this sample was just 1.2x, versus the highest at 70x. Spend volumes are high, meaning the businesses in this sample experienced high demand from GLSAs - that may not be you or your market, which is why it is so critical to track this data for your business.
As a refresher, below are the performance metrics (YoY) for December 2024 GLSA:
Spend: +113% YoY
Unique Leads: +92% YoY
Cost per Unique Lead: $59.86 (+11% YoY)
Customer Acquisition Cost: $291.84 (+30% YoY)
ROAS Potential: 16.1x
ROAS Closed: 7.8x
Closed Revenue per Business: $141,693 (+71% YoY)
58% of unique leads from Google LSA channels in December 2024 did not convert to a booked appointment. In some cases, 80% of unique leads from GLSAs didn’t book appointments!
Nearly 50% of booked appointments turned into paying customers, and in this sample, just a 5% increase in book rate would translate to almost $24,000 in additional revenue for the month ($288,000 annualized).
We have now begun integrating our homegrown AI lead grading solution into our larger attribution platform for the most robust actionable lead detail and insight at you fingertips at an affordable price point to improve booking rates and maximize closed revenue.
If this interests you, check out this page, fill out our form and we’ll get in touch about early access.
With that, let’s dive into January 2025 GLSA data! Note: Spend was up 71% year-over-year and 11% month-over-month.
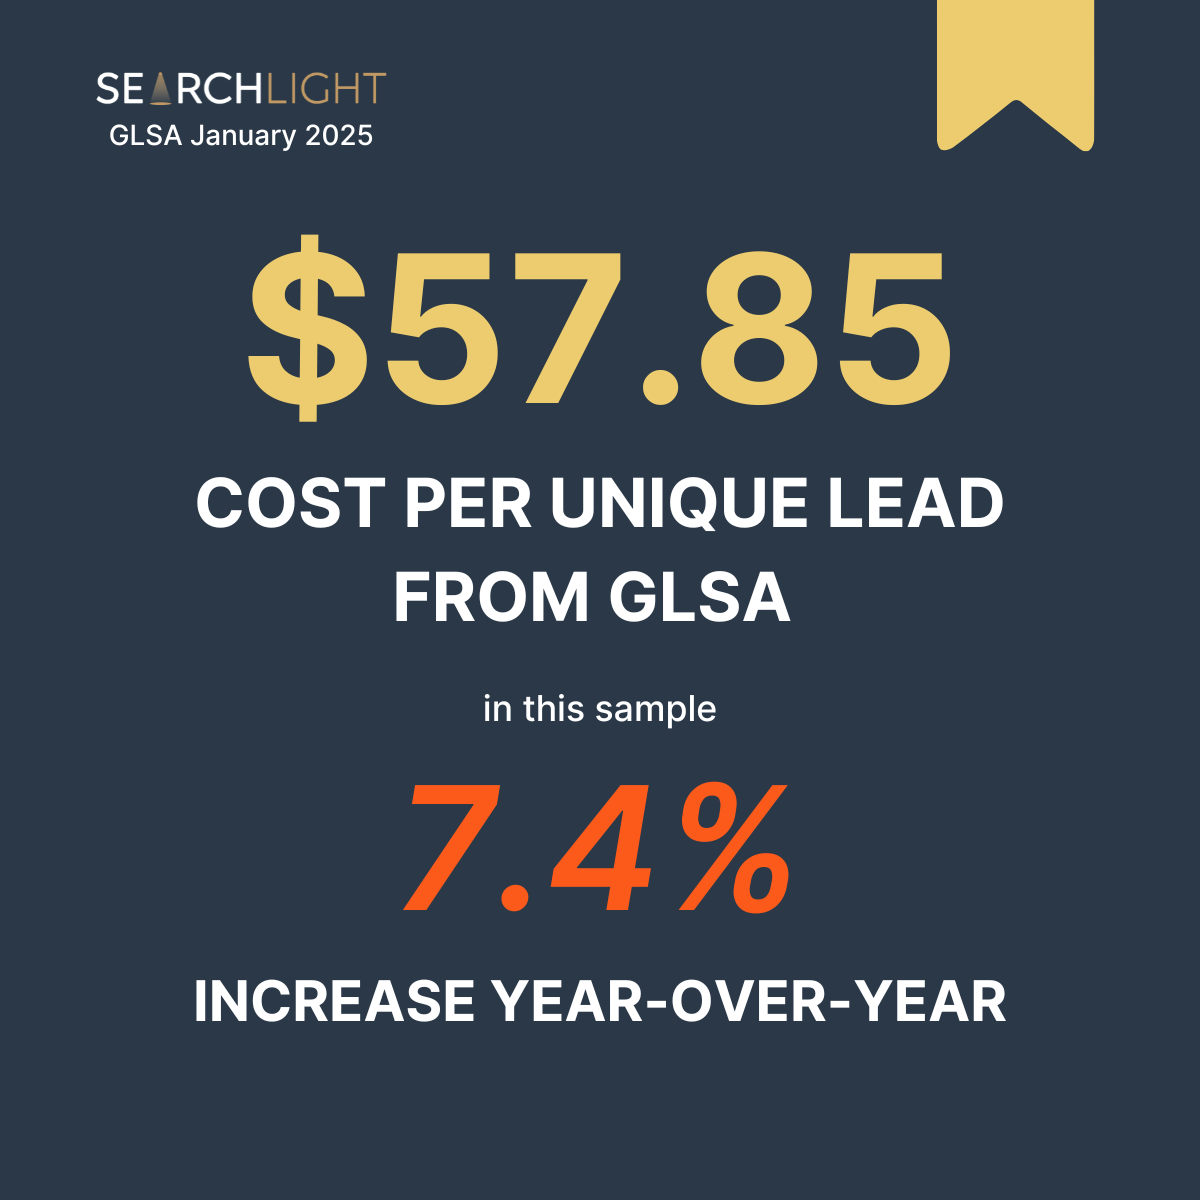
Unique Leads from GLSA Increased by 60% Year-over-Year
With spend up a substantial 71% from the prior year, unique lead volume was also up YoY with a 60% increase.
Unique lead volume was up month-over-month (+14%) on an 11% spend increase.
The booking rate of those unique leads also improved slightly month-over-month and year-over-year.
And while each unique lead cost slightly more than in 2024:
The number of run jobs increased 66% year-over-year and the number of paying customers increased 60% year-over-year.
On average, the businesses in this sample spent ~$8,800 more on GLSA in January 2025 than in January 2024.
That additional spend drove 136 more leads per business on average (from 228 unique leads each in 2024 to 364 unique leads each in 2025).
Of the active customers in January 2025 from GLSA, roughly 19% became paying customers.
Because of that, we can estimate that 25 of those 136 unique leads would convert to a paying customer, and at an average ticket of $2,613, drove $65,325 in additional revenue.
That’s a 7.42x ROI for every additional $1 spent vs. 2024, making that additional spend worth it.
Average tickets were also up 11%, resulting in $260 more spent per paying customer, more than making up for the increase in cost per unique lead, and nearly covering the entire acquisition cost of a paying customer from GLSA, as we’ll see below.
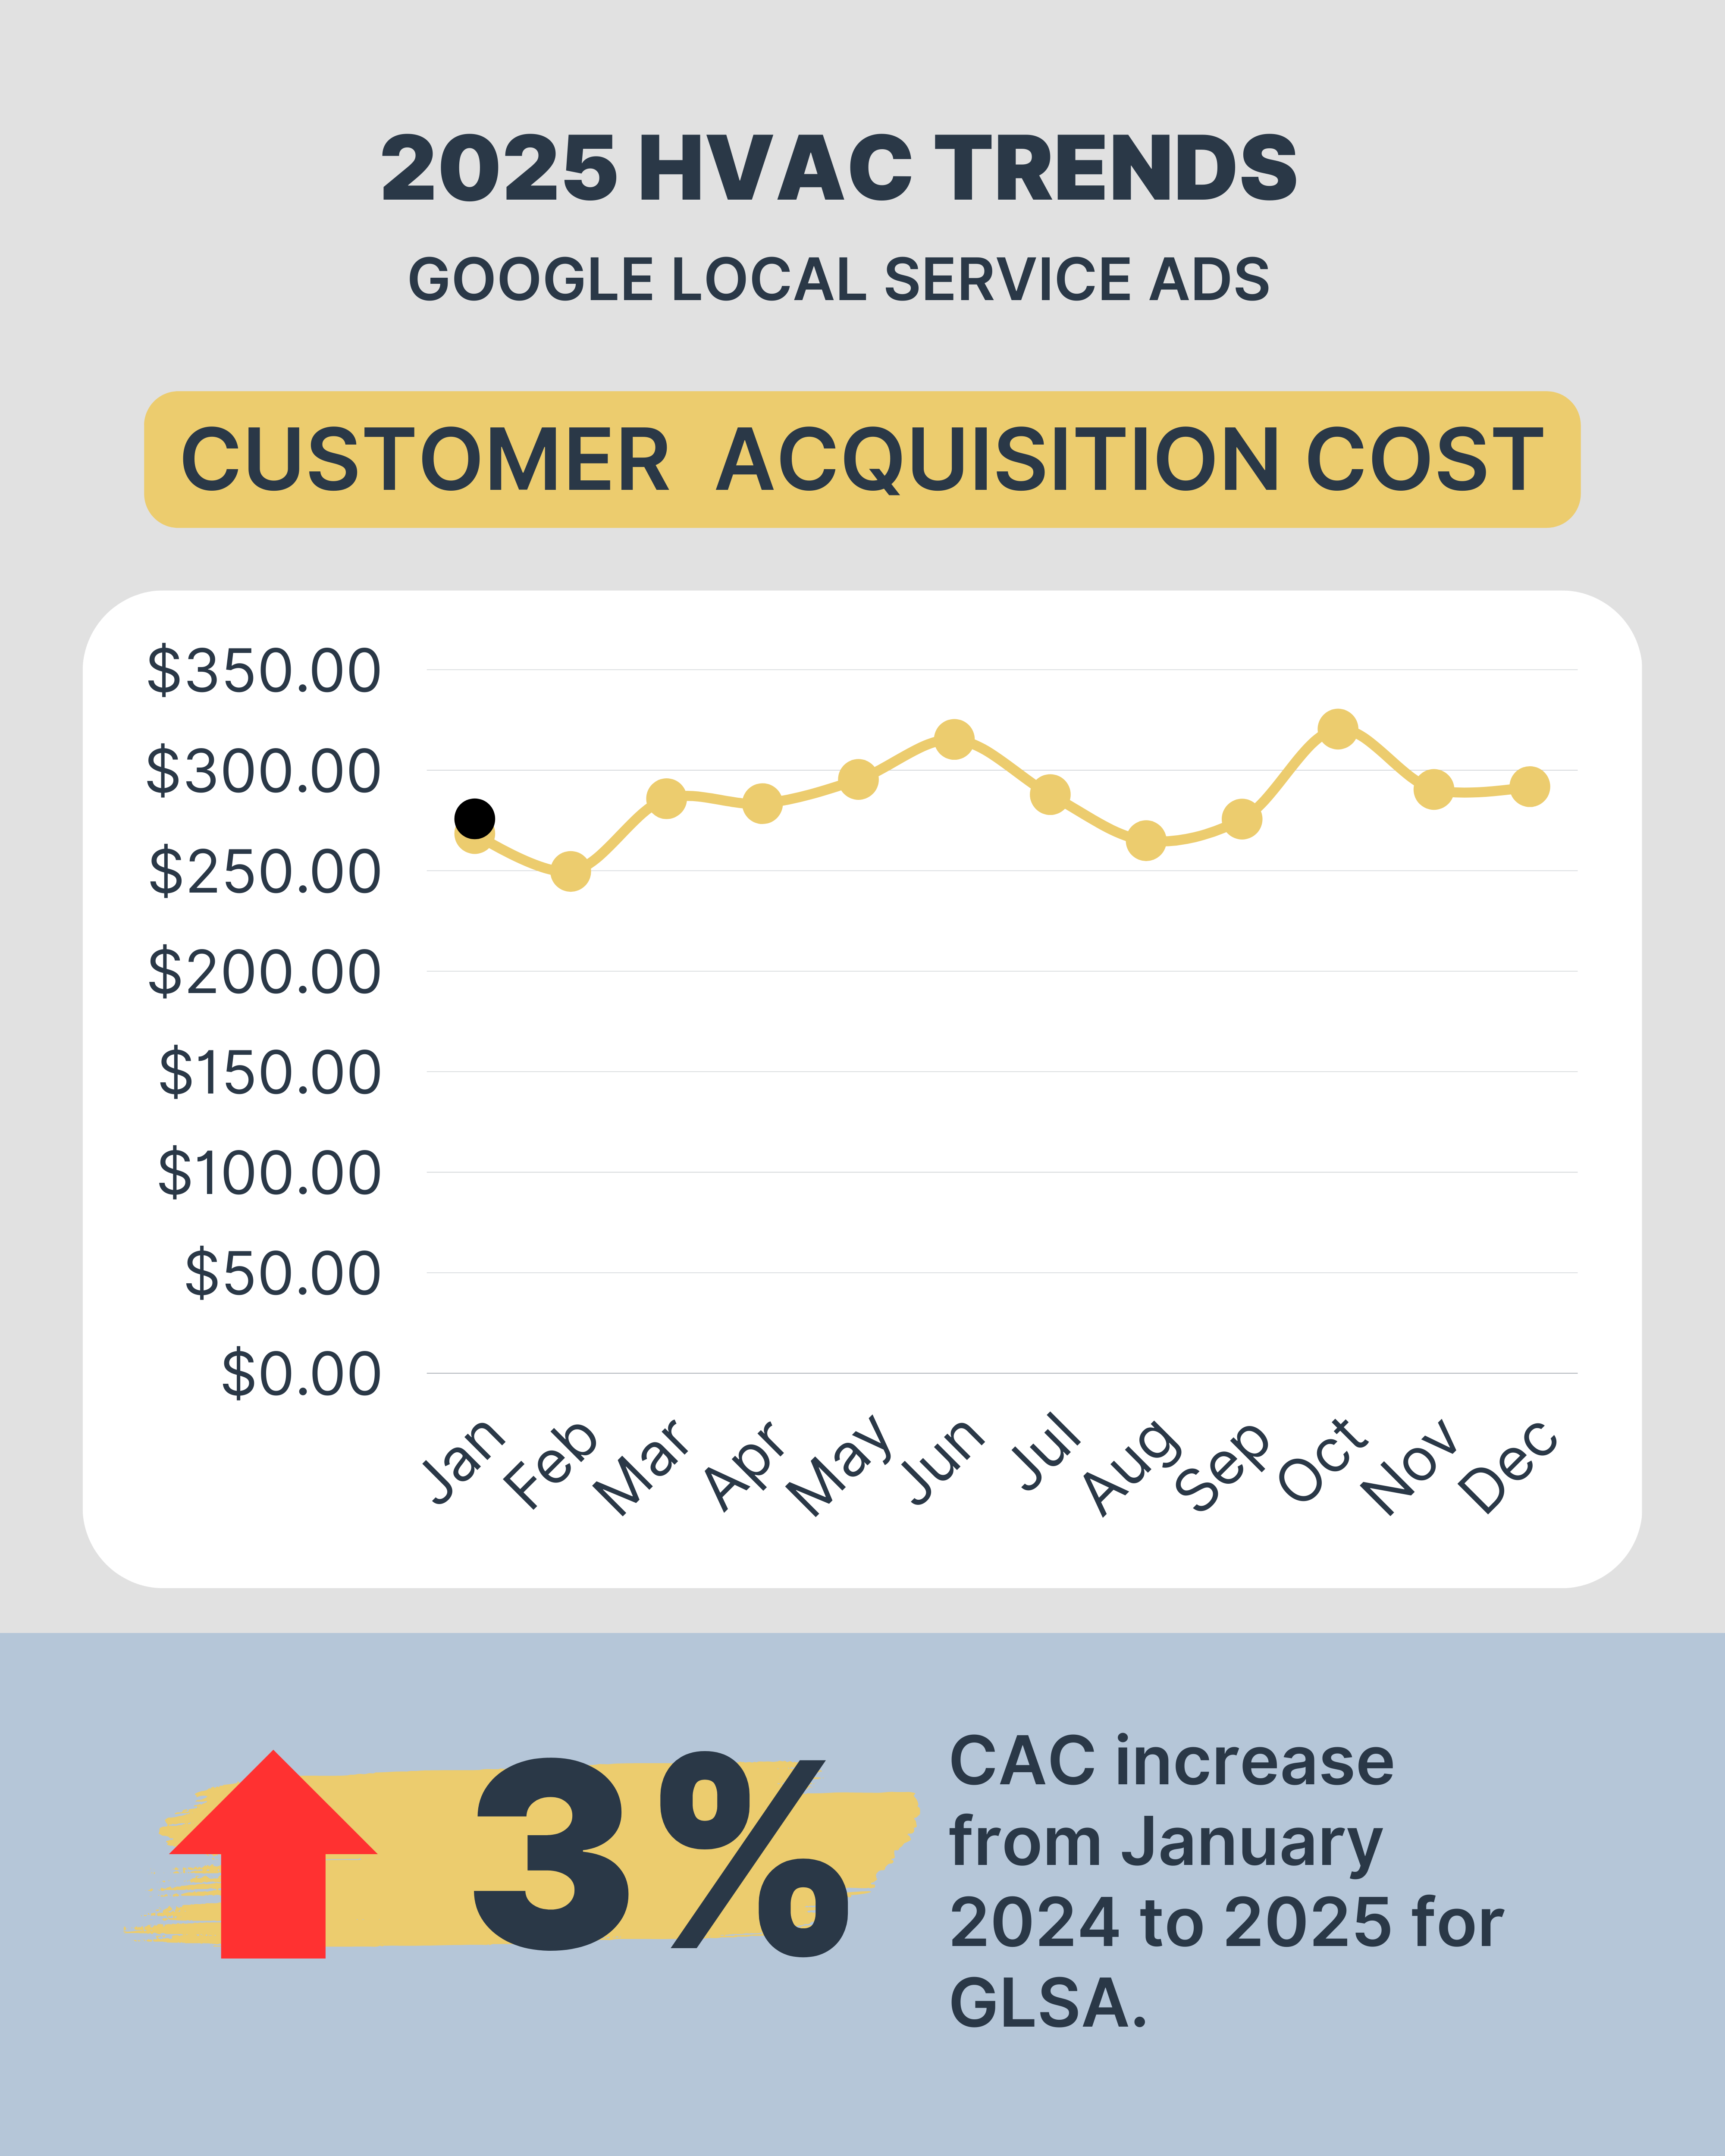
It Cost $275.80 to Acquire a Paying Customer from Google LSAs in January 2025
Customer acquisition costs remained fairly steady in 2024, with expected peaks in the summer (June) and early winter (October) seasons.
2025 has started out with a slight (+3%) increase in CAC, but is in line with what we saw in 2024:
Because GLSA is on a cost-per-lead model, it is expected that CAC remains relatively stable and is more impacted by lead quality and operations (book rate, match rate, paying customer rate) than ad platform costs.
So, as a thought exercise building on my scenario (increasing book rates by 5%) in the introduction section, an increase in book rate by just 5% would lower customer acquisition costs by $30 in this sample.
If all businesses in this sample booked just 5% more leads, it would have cost $245 per paying customer vs. $275 per paying customer, which goes to show how powerful even small percentage increases can effect efficiency and performance.
Google LSAs Drove a 17.1x Return on Ad Spend Potential in January
For every $1 spent on GLSA in January ‘25, $17.10 of revenue opportunity was generated.
The opportunity comprises estimates, sold jobs, and closed jobs of leads that originated from GLSA (note that we only take one estimate per customer, and a customer can exist in just one of those buckets at a given time period to avoid double counting).
To make this more tangible, across this sample of businesses, $359,887 (up from $292,197 in December) in revenue opportunity was generated from GLSA per business in December, a 23% month-over-month increase and 75% YoY increase:

On average, the business in this sample had $154,887 more in revenue opportunity this year than last from spending $8,800 more this year (17.6x ROI potential on that additional spend).
Google LSAs Drove a 8.2x Return on Ad Spend (Closed Revenue) in January
For every $1 spent, GLSAs drove $8.20 in closed revenue.
That equated to $173,687 (up from $141,693 in December) in closed revenue per business for January converted by GLSA:

Compared to last year, the $8,800 in additional spend per business generated an average of $75,000 in net new closed revenue, amounting to a 8.5x return on ad spend closed revenue on the additional spend.
Of the total closed revenue in January generated by Google Local Service Ads, 70% came from new customers.
The sheer volume of revenue from GLSAs has substantially increased from 2024 and the volatility experienced early last year seems to be smoothing out.
The accounts in this sample are top performers (there is bias in that they use our attribution platform to make data-driven decisions), so ROAS may be more useful for you than volume, but the number of accounts generating six-figures+ of closed revenue from GLSA is a strong indicator of how that channel is maturing and becoming a formidable revenue generation source.
In addition to the closed revenue growth, sold revenue in January was also up 48%, indicating a strong start for February, so let’s take a look at the first 10 days of the month👇
February 2025 GLSA Preview
We now have 10 days of data for February, so let’s peak at a few trends for GLSAs so far this month (compared to the first 10 days of January):
Spend: -24%
Unique Leads: -21% MoM
Cost per Unique Lead: $55.74
Customer Acquisition Cost: $229.88 (-8%)
ROAS Potential: 19.8x (+9%)
ROAS Closed: 8.7x (+17%)
Closed Revenue per Business: $43,204 (-10%)
The first 10 days of February is off to a slower start than the first 10 days of January.
Efficiency (CAC + ROAS numbers) look good, but unique lead volume and closed revenue volume have both dropped.
The lack of leads likely will show up later in the month giving February a potential of a downturn, although as we are deep in the shoulder season, this would be expected.
Until next time . . .
-Jon