HVAC Demand Trends: Google LSA Revenue Performance - August 2024
👋 Hey, Jon here! This week, we’re reviewing Google LSA performance for August with some new year-over-year data!
Note: This data is from a sample of ~25 businesses across the US. Shout out to Josh Crouch and his team at Relentless Digital, who partnered with us to measure lead-to-revenue from their organic and GLSA management services, enabling us to share these trends with you.
As a refresher, below is a summary of July’s performance:
Spend: -16%
Conversions: -10%
Customer Acquisition Cost: $253.82
ROAS Potential: 19.1x
ROAS Closed: 11.6x
Note that spend on GLSA decreased 23% from July to August.
Unique Leads from GLSA Decreased by 20% From the Prior Month
After three consecutive months of lead growth from Google Local Service Ads (April, May, June), July lead volumes decreased by 10%, and now August lead volume has decreased by 20%:
63% increase from March to April
19% increase from April to May
44% increase from May to June
10% decrease from June to July
20% decrease from July to August
LSA lead volumes peaked in June with rapid growth since March, and while they have come down the last two months, lead volume is still higher than it was at the beginning of the year.
However, lead volume is down 21% year-over-year, so even though we expect comedowns from June, we see less top-of-the-funnel demand than the prior year.
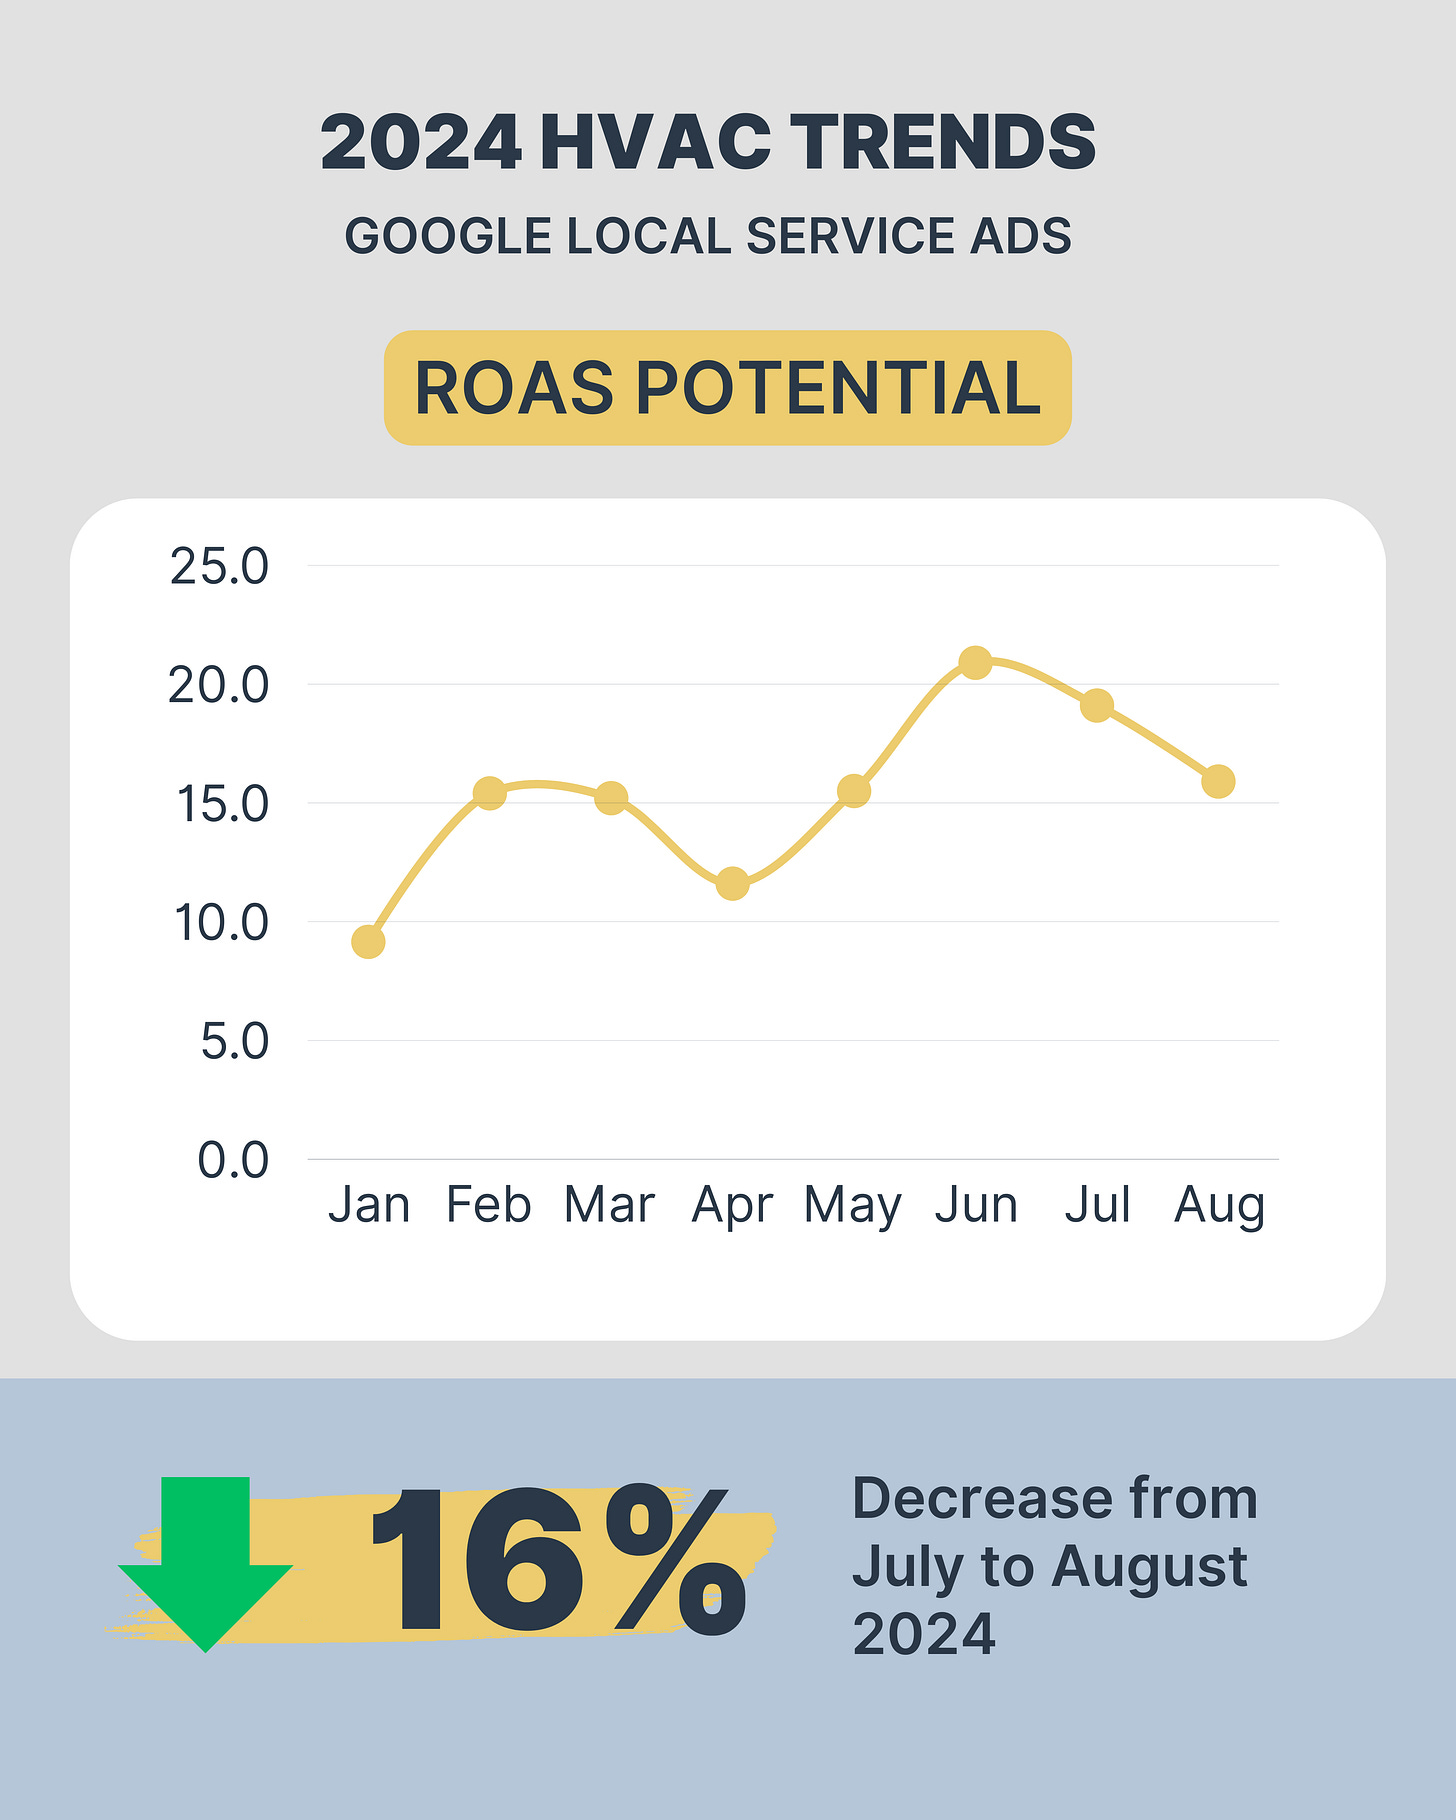
Google LSAs Drove a 15.9x Return on Ad Spend Potential in August
Despite a reduced lead volume month over month and year over year, LSAs still produced a 15.9x return on ad spend potential.
Return on ad spend potential quantifies all sellable opportunities (taking an average of the estimates given to avoid double-counting) generated by LSAs in August.
For every $1 spent, the businesses in this sample could earn $15.90 in return, a decrease of 16% month over month and 4% year over year.
We know that 100% of the revenue opportunity won’t close. However, this metric is still useful because it helps you understand the total demand from a channel, if there’s enough opportunity to justify continued investment, and how well you’re converting opportunities into sold and closed revenue.
The opportunity conversion rate comes into play for overall performance (as we’ll see in the next section) because it means even with reduced revenue potential, you aren’t destined to have a lower closed ROAS as well.
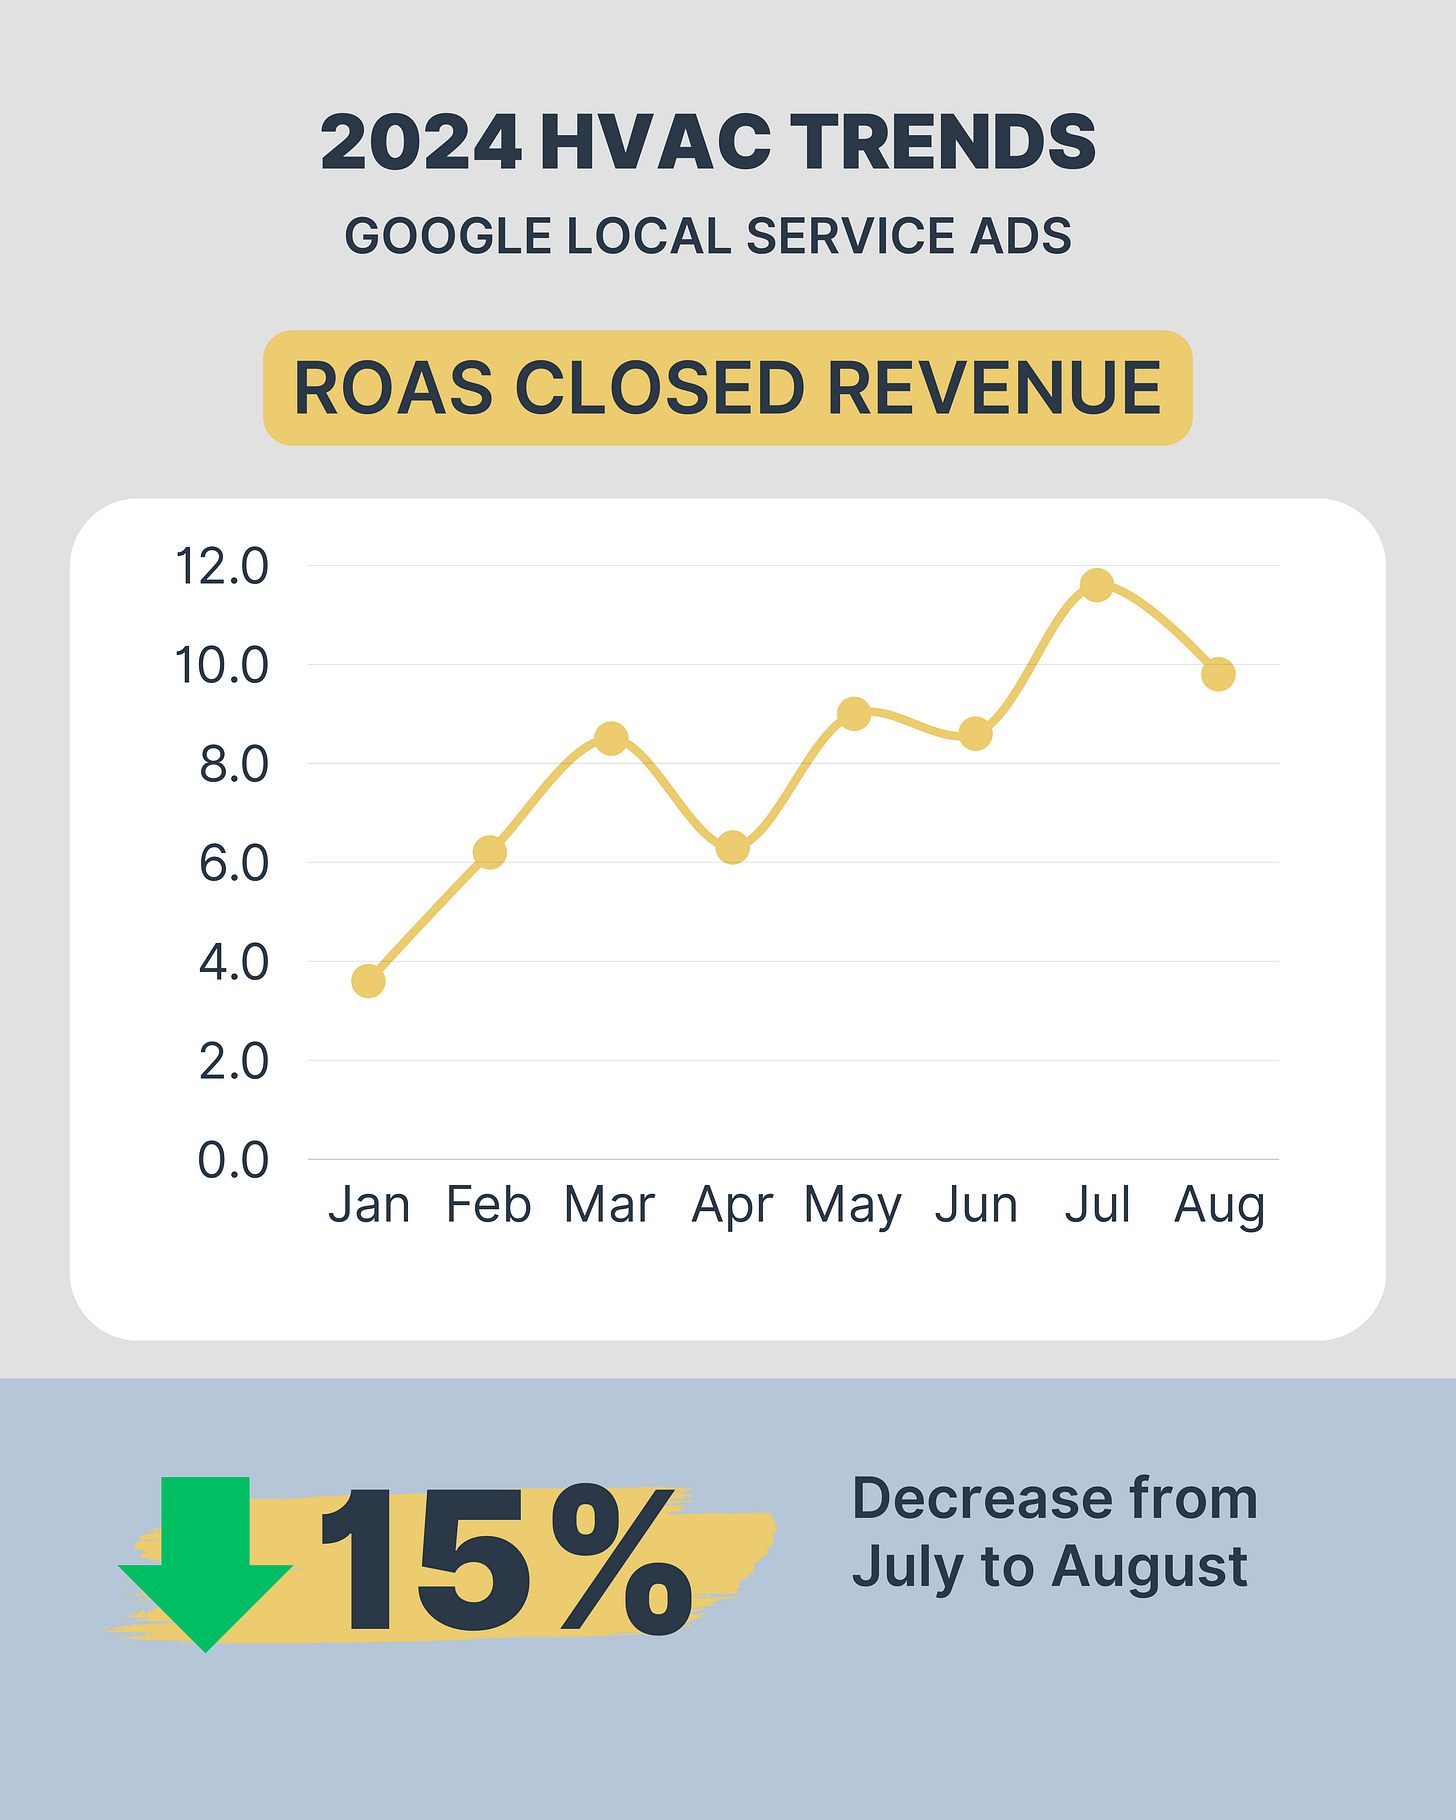
Google LSAs Drove a 9.8x Return on Ad Spend (Closed Revenue) in August
Year over year, closed ROAS increased 19% despite 4% less revenue opportunity than last year.
Last year, the August ROAS from LSAs was 8.2x, so in 2024, $1.60 more was earned per dollar spent.
However, closed revenue decreased by 15% month over month, which aligns with the reduced total revenue opportunity (-16%).
Still, these are solid returns (just not as much volume as organic and PPC), with a nice year over year bump.
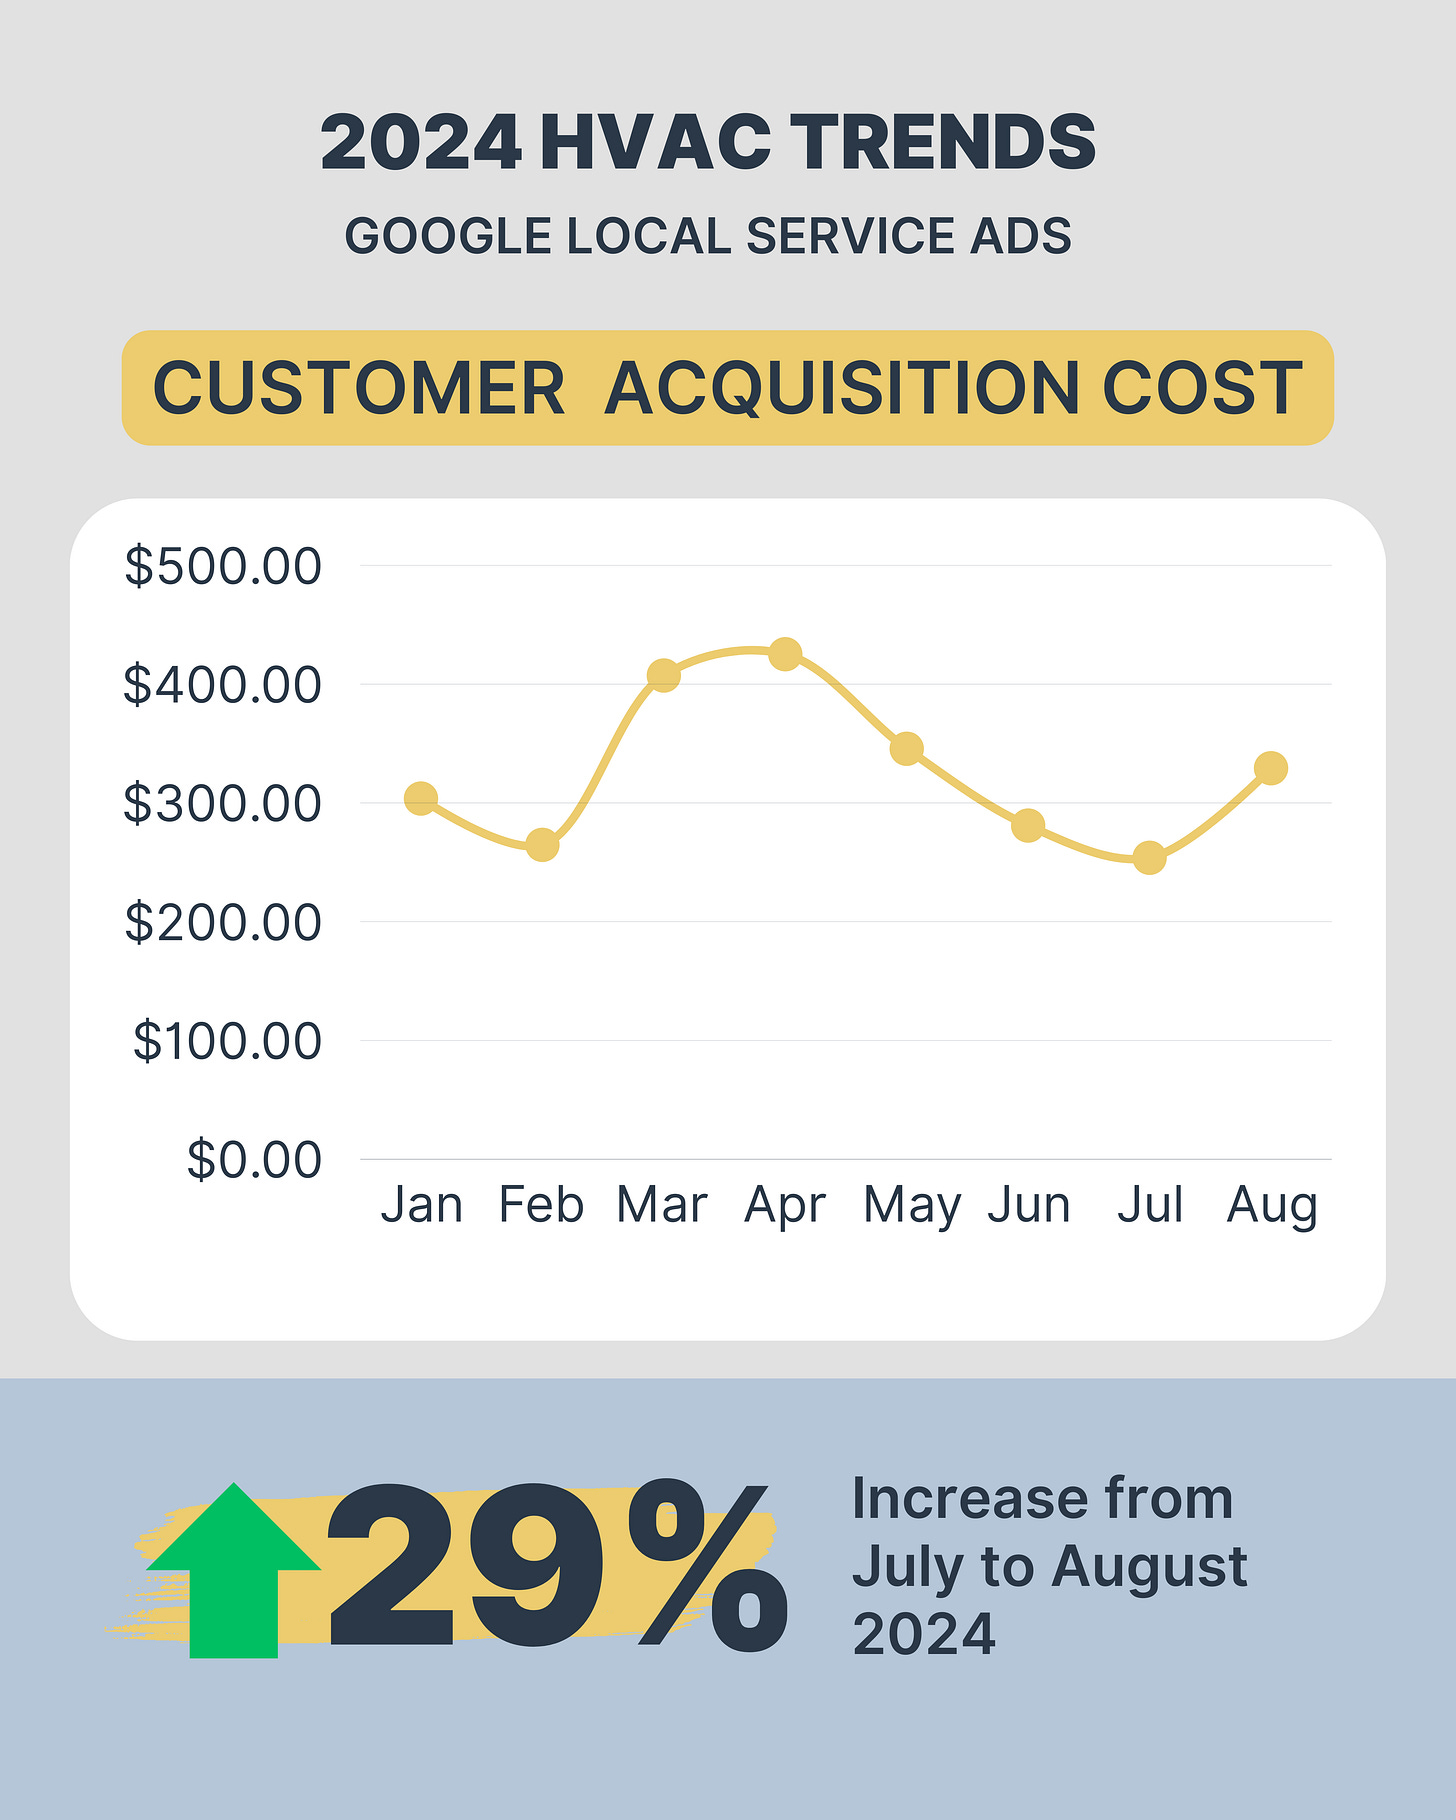
It Cost $329.21 to Acquire a Paying Customer from Google LSAs in August
Customer acquisition costs came up after hitting a 2024 low in July, coming close to what they were in May, but this is expected.
June/July is typically the time of year when top-of-funnel demand is highest, and it is the least expensive to acquire paying customers from various channels.
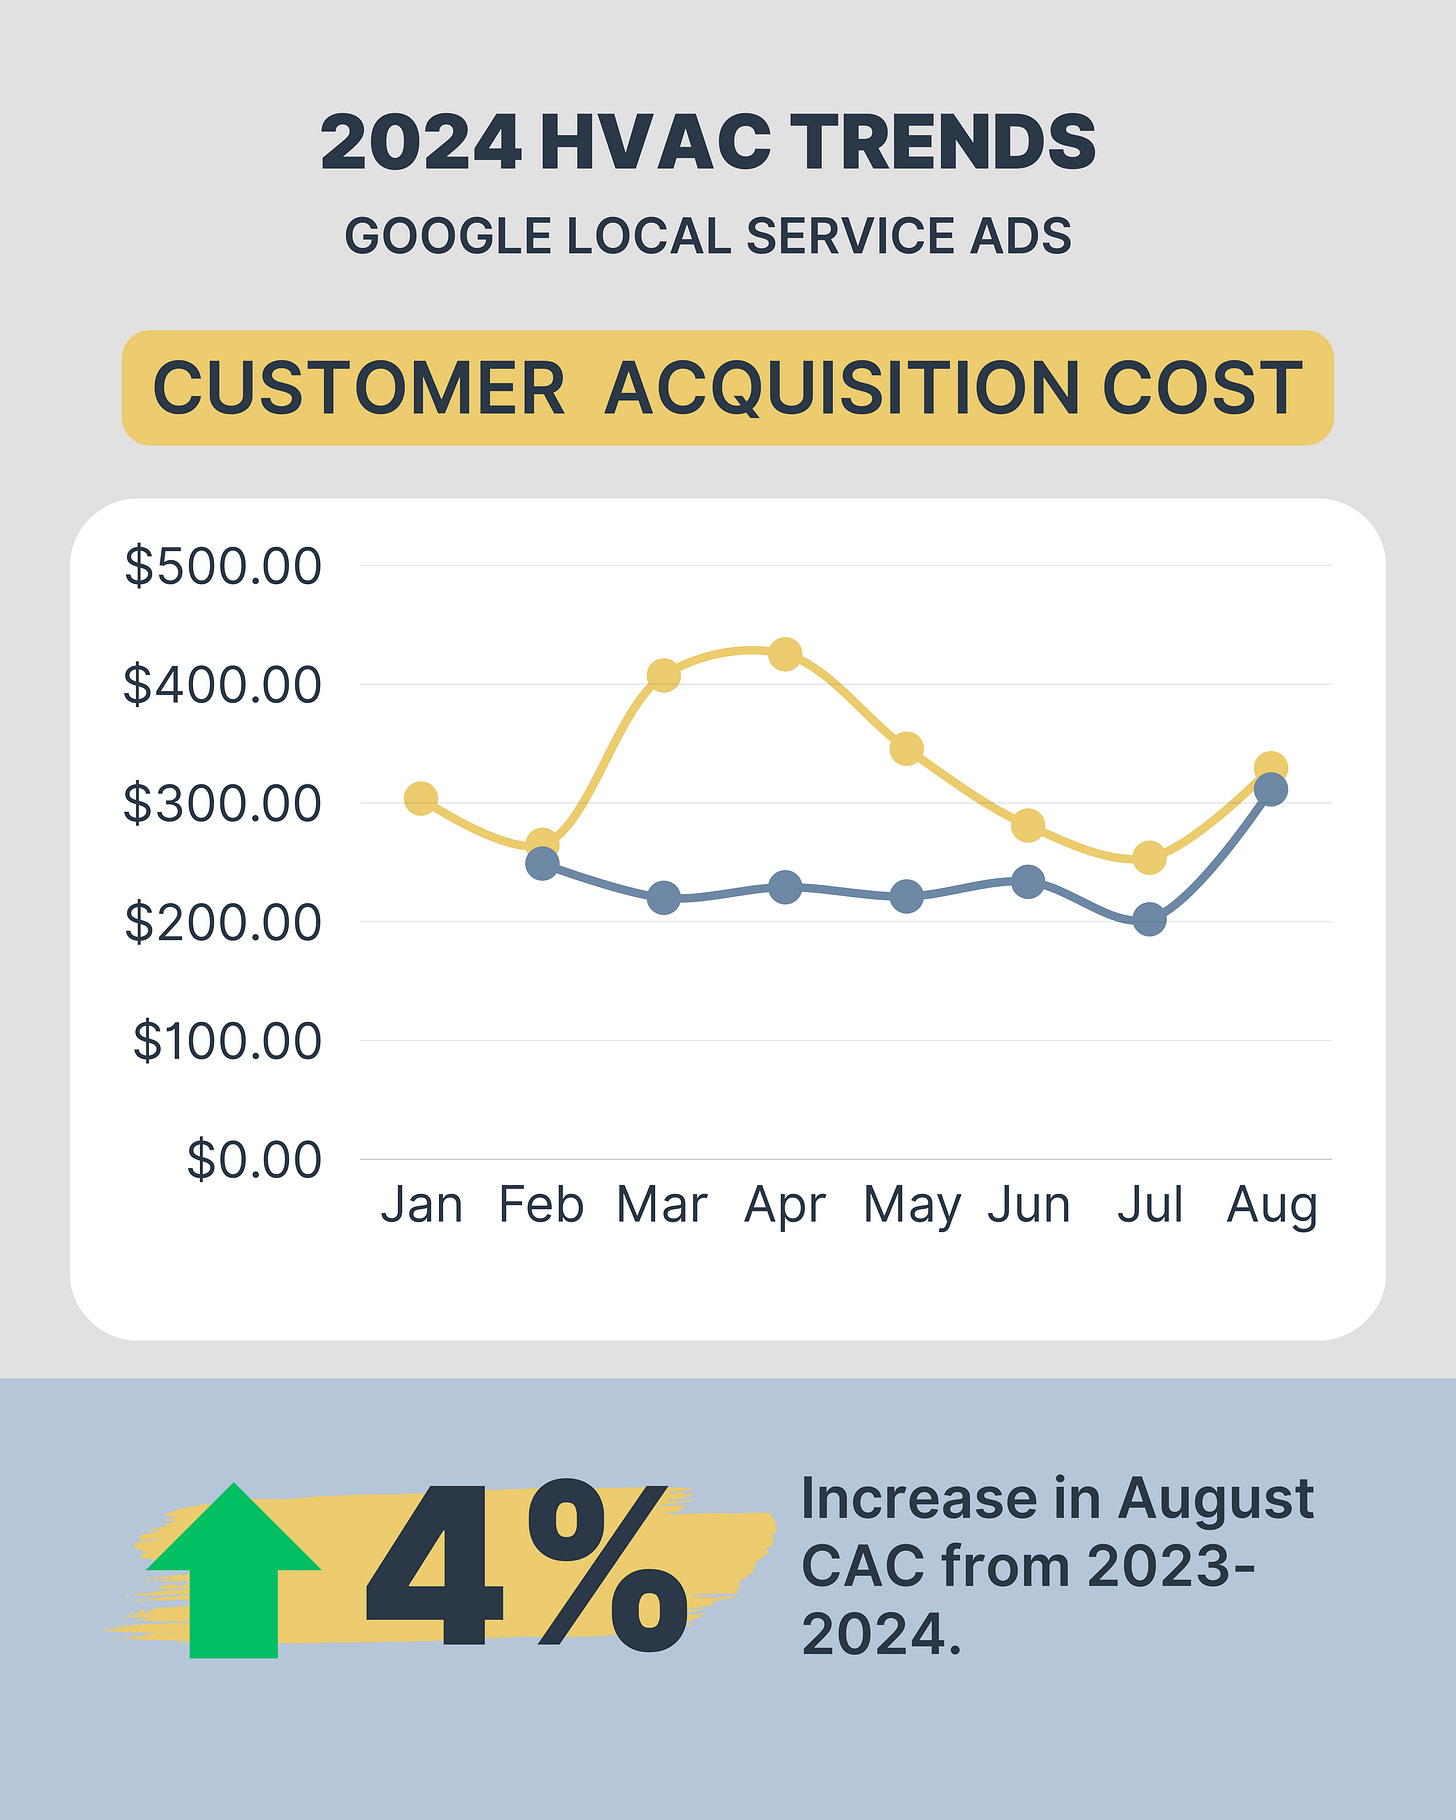
We also saw a year-over-year increase in CAC for LSAs by 6% (2023 CAC was $311.38), but average tickets also increased 4% YoY, almost off-setting that cost:
As we continue into the fall months and shoulder season, it is even more critical to monitor your KPIs and make actionable adjustments as the margin of error does reduce a bit with less overall demand.
Until next time . . .
-Jon


