HVAC Organic Demand Trends - December 2024
👋 Hey, Jon here! Happy New Year 🥳🥳
I am really excited for 2025 with The Data Driven Trades newsletter and I think you all are going to love what’s coming. There’s SO much exciting data, not just from the channels I’ve been writing about over the last 2 1/2 years, but even more since our engineering and product teams have been hard at work expanding our platform. More to come on that, but some weeks, you will start receiving two e-mails.
This week, we are exploring December’s Organic revenue performance with the continued use of our larger data set (more businesses in different areas of the US).
The organic channels in this sample include Google and Bing Organic Listings, Google Business Profile, Organic Facebook, Yelp Organic, and DuckDuckGo.
Before we get into the December data, I’ll summarize November’s data below.
Below are the YoY trends comparing November 2024 to November 2023:
Unique Lead Volume: +10% YoY
Customer Acquisition Cost: $51.89 (-7% YoY)
Average Ticket: +1.5% YoY ($2,856)
Sold Revenue: +10% YoY
Closed Revenue New Customers: 19x return on investment
Closed Revenue Total Customers: 44.1x return on investment
With that, let’s dive into December 2024!
Organic Unique Lead Volume Increased by 41% Year-over-Year
Unique lead volume from Organic channels was down 5% month-over-month, but increased 41% year-over-year.
In this sample, businesses got ~232 unique leads from organic in December (new and existing customers).
New customer leads were down 9% month-over-month, but up 24% year-over-year with each busineses getting 38 new customer unique leads from organic channels on average.
That means 16% of total unique organic leads were from new customers.
I know organic channels typically drive customers familiar with the brand, but it did surprise me that the % of unique leads that were new customers was so low.
But more than half of those 38 unique leads (22 total) ended up buying something from the business.
That’s less than 1 new customer per day, so it’s important to make those leads count.
Paying customer rate did decline for new customers, but only slightly (-3%) from the prior year.
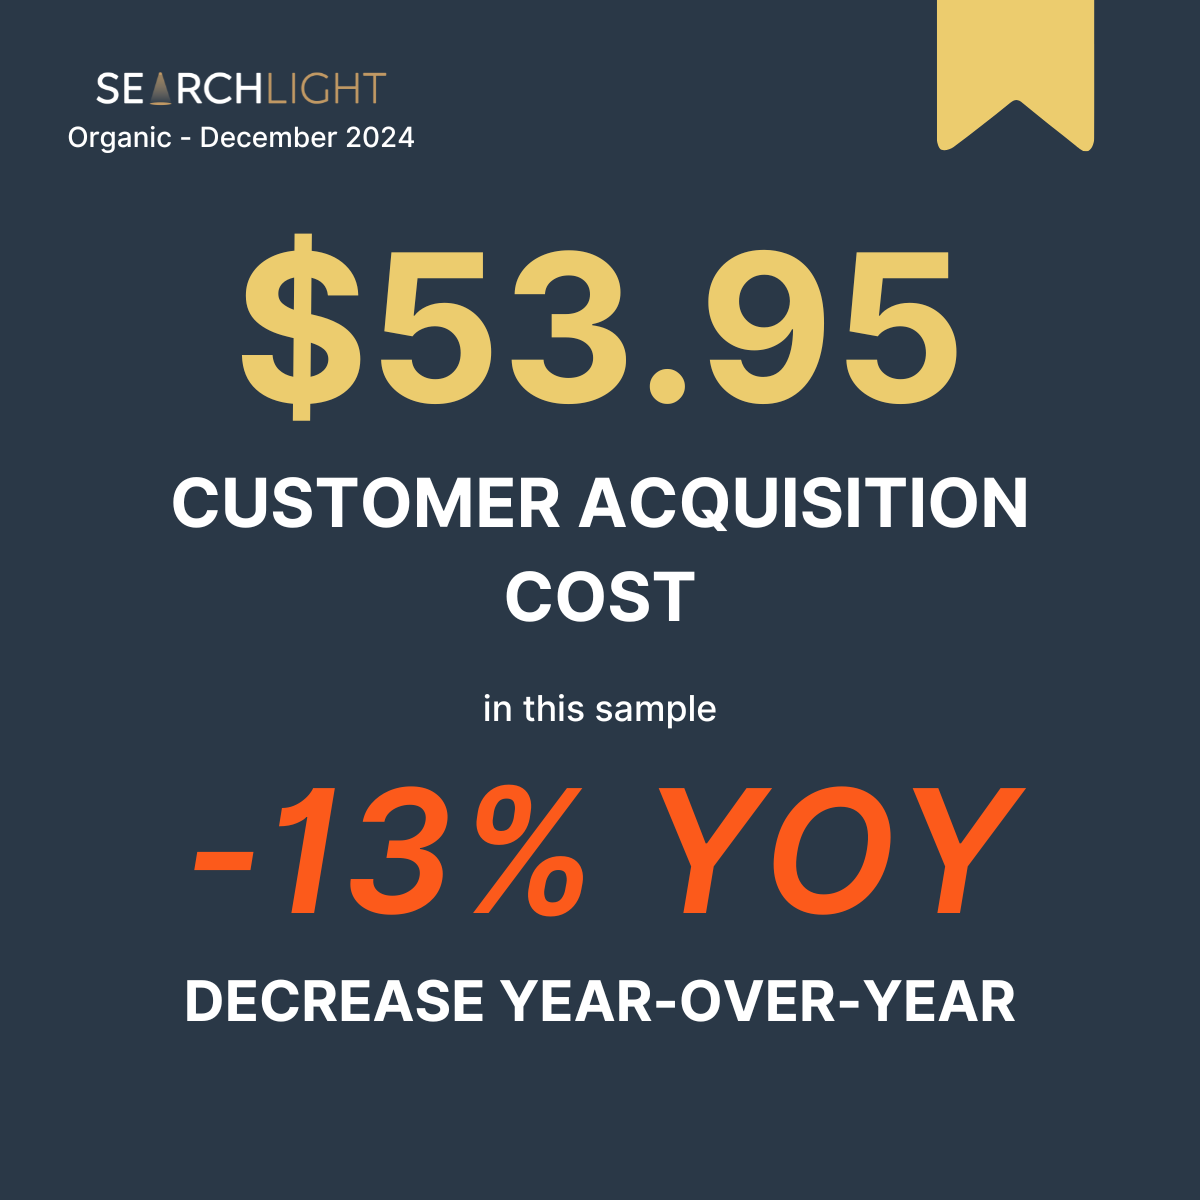
It Cost $53.95 to Acquire a Paying Customer From Organic Channels in December, Down 13% Year-over-Year
Customer acquisition costs remained largely unchanged month-over-month (+1%), which is expected given that organic leads are ‘free’ and the cost-basis we use to create these metrics are the provided SEO fees.
Efficiency can lower these costs (improved booked rates, match rates, paying customer rates), but lower CAC can also be indicative of higher overall demand, similar to GLSAs.
Organic is the least expensive out of PPC and LSA, but does have a smaller % of new customers in that mix.
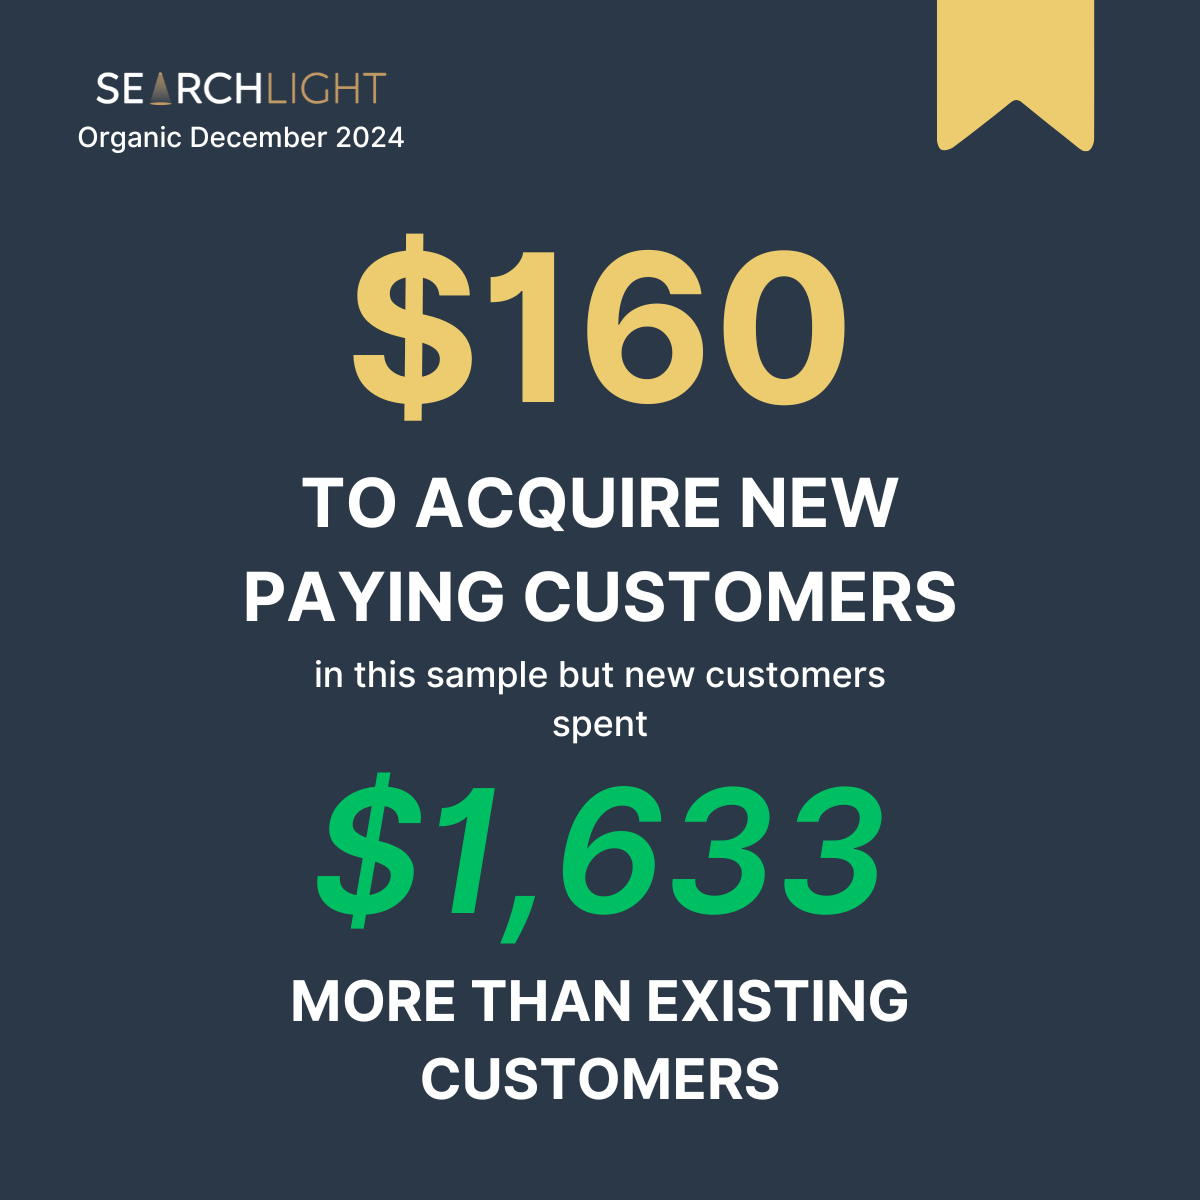
It cost $160.70 to acquire new customer from organic channels, and once again, Google Business Profile generated the most new customer leads and revenue out of the organic channels measured in this sample:

And even though it was more expensive to acquire a new paying customer from organic channels, those customers spent an average of $1,633 more than existing customers.
That difference alone is a 10x on just the additional CAC compared to existing customers:
Let’s dive a little deeper into average tickets 👇
Average Tickets Increased by 2% Year-over-Year
Across new and existing customers, average tickets were $2,909 for December, up 2% year-over-year and 1% month-over-month.
New customers spent $4,001.84 on average, up 13% year-over-year.
If we go a step further, we can see the break-down of average tickets by channel, across new and existing customers:
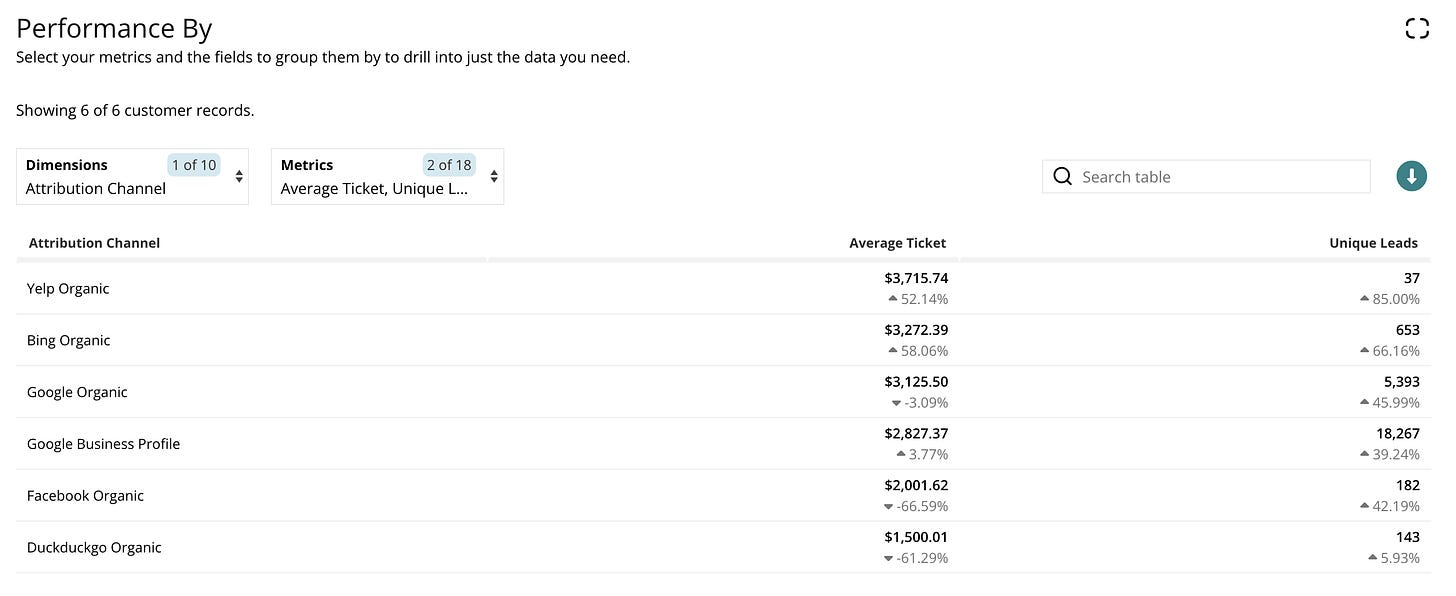
And we can go even a step further, filtering down to only New Customer average tickets by organic channel:
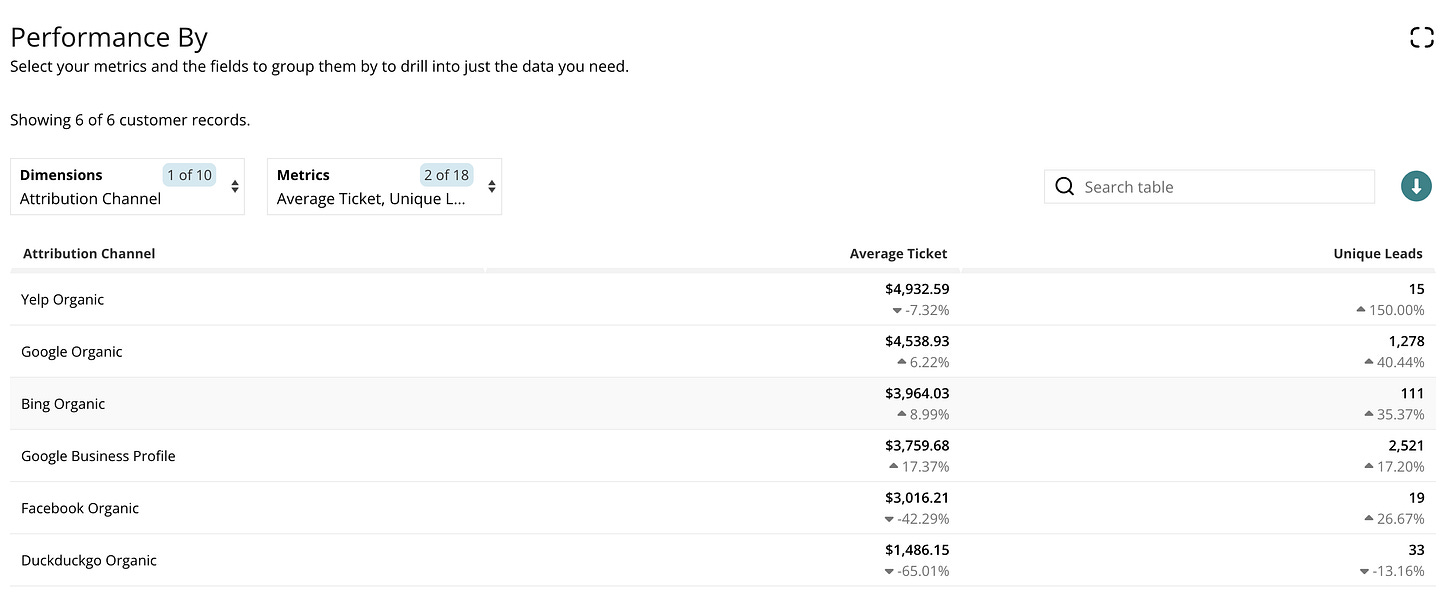
I added unique leads as a second metric (out of 18 total you can add to this table) to highlight volumes, but you can see that with Yelp organic, despite lower volume, the channel drove the highest average tickets across new customers and new+existing.
When looking at both volume / tickets on new customers, Google Organic, which drove substantial volume of new customer unique leads, had strong average tickets, up 6% year-over-year.
Note: The percentage increases and decreases are all year-over-year.
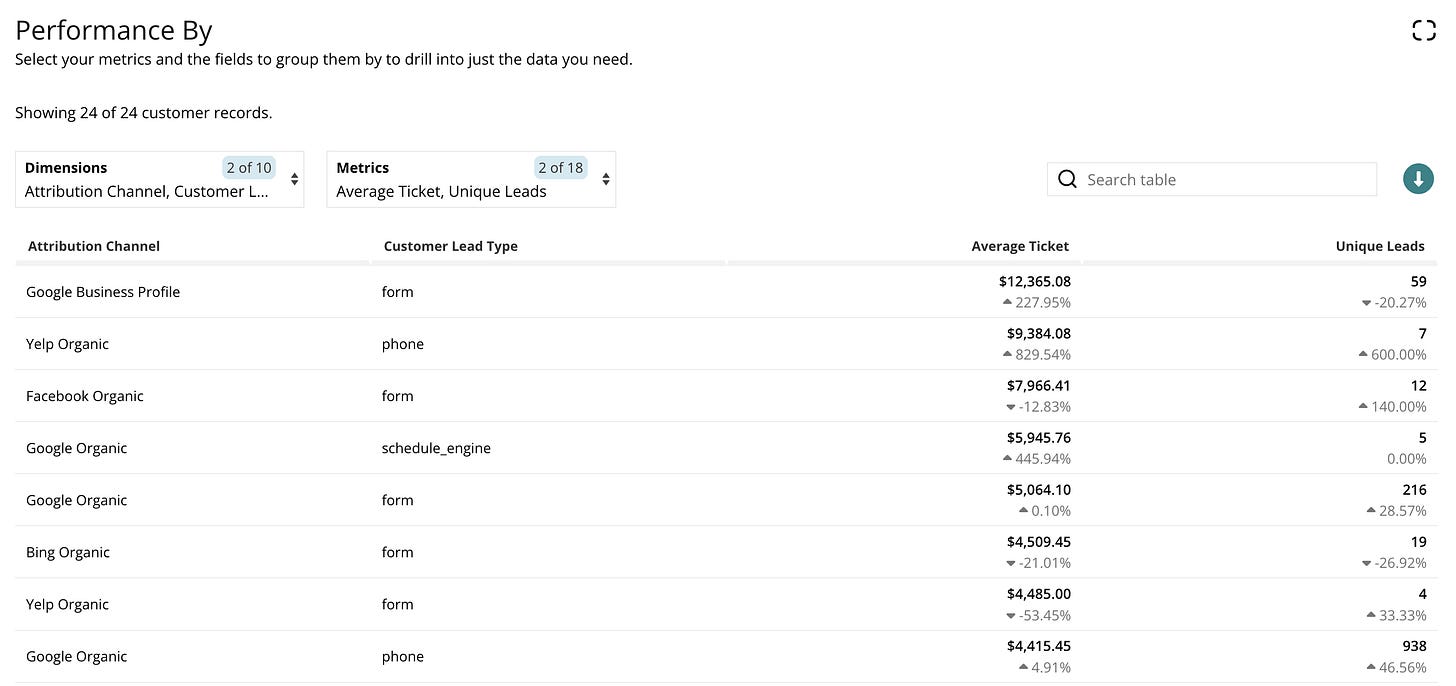
For one last view, I added a second dimension so we could look at average tickets by both channel and conversion tool for new customer leads only:
I highlighted the top 8 here to keep it simple, but you can see that across these accounts, 59 unique leads converted via website forms by way of the Google Business Profile, spending $12,365 on average.
Only 2 of the 9 top average tickets came from phone calls, as the rest were from forms or online scheduling (which may influence how you prioritize or provide resources for lead handling to avoid missing these revenue opportunities).
Sold Revenue from Organic Leads Increased 37% Year-over-Year
The sold revenue metric is important, because it gives us a sense for what is in the pipeline to start a new month.
While sold revenue was down 11% month-over-month, it was up 37% year-over-year ($34,986 in sold revenue per business on average).
For new customer only, sold revenue was down 10% month-over-month, but was up 41% year-over-year ($17,835 in sold revenue from new customers per business on average).
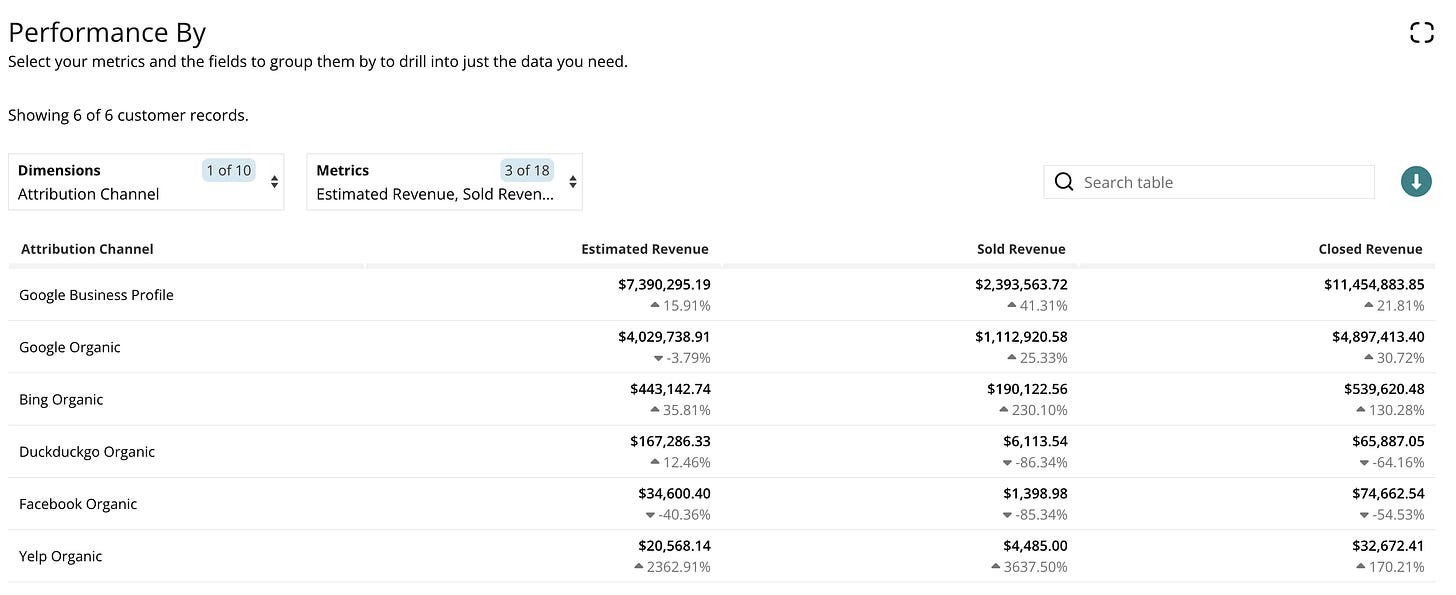
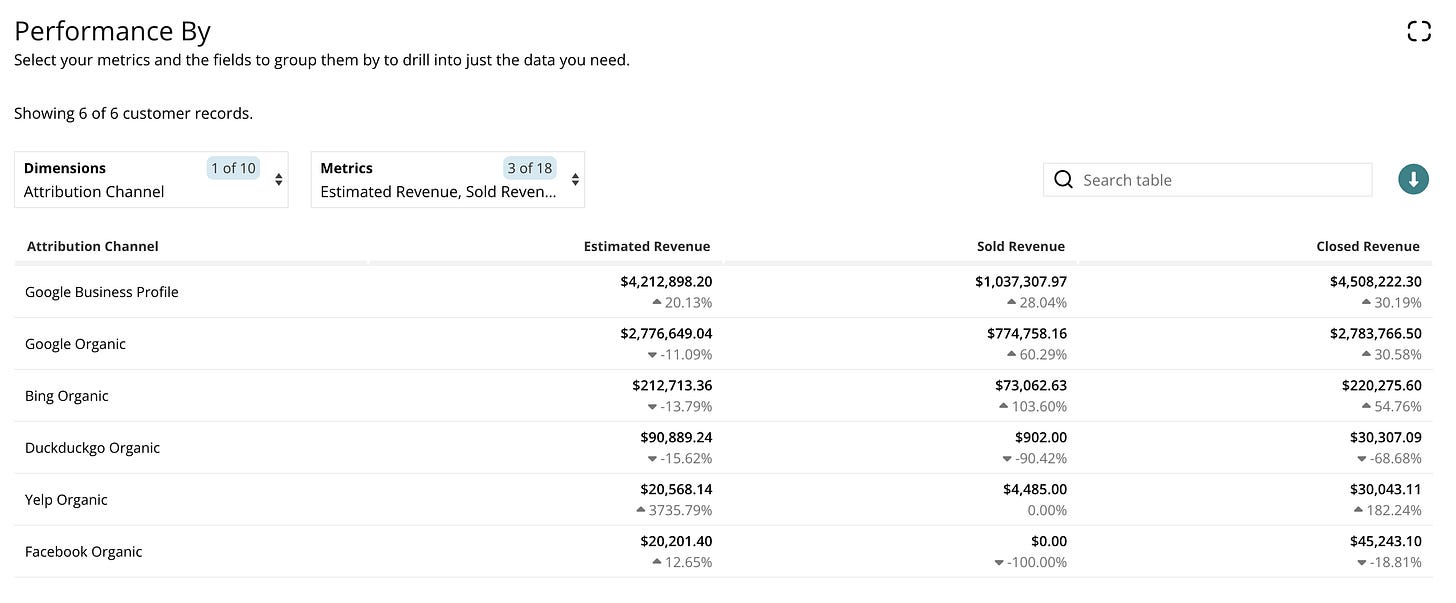
We can go a little deeper, too, using the Performance By view to break down revenue by category and by channel.
New and existing customers:
New customers only:
This view makes it easy to see the volume of revenue in each bucket of the sales funnel, broken out by channel within the Organic category.
Closed Revenue from Organic Leads Increased by 24% Year-over-Year
Closed revenue volume from organic channels increased 24% year-over-year and increased 1% month-over-month (note, the sample size changed slightly from last month, so if you review November’s data you will see higher closed revenue per business, but the MoM and YoY changes reflect the updated data set).
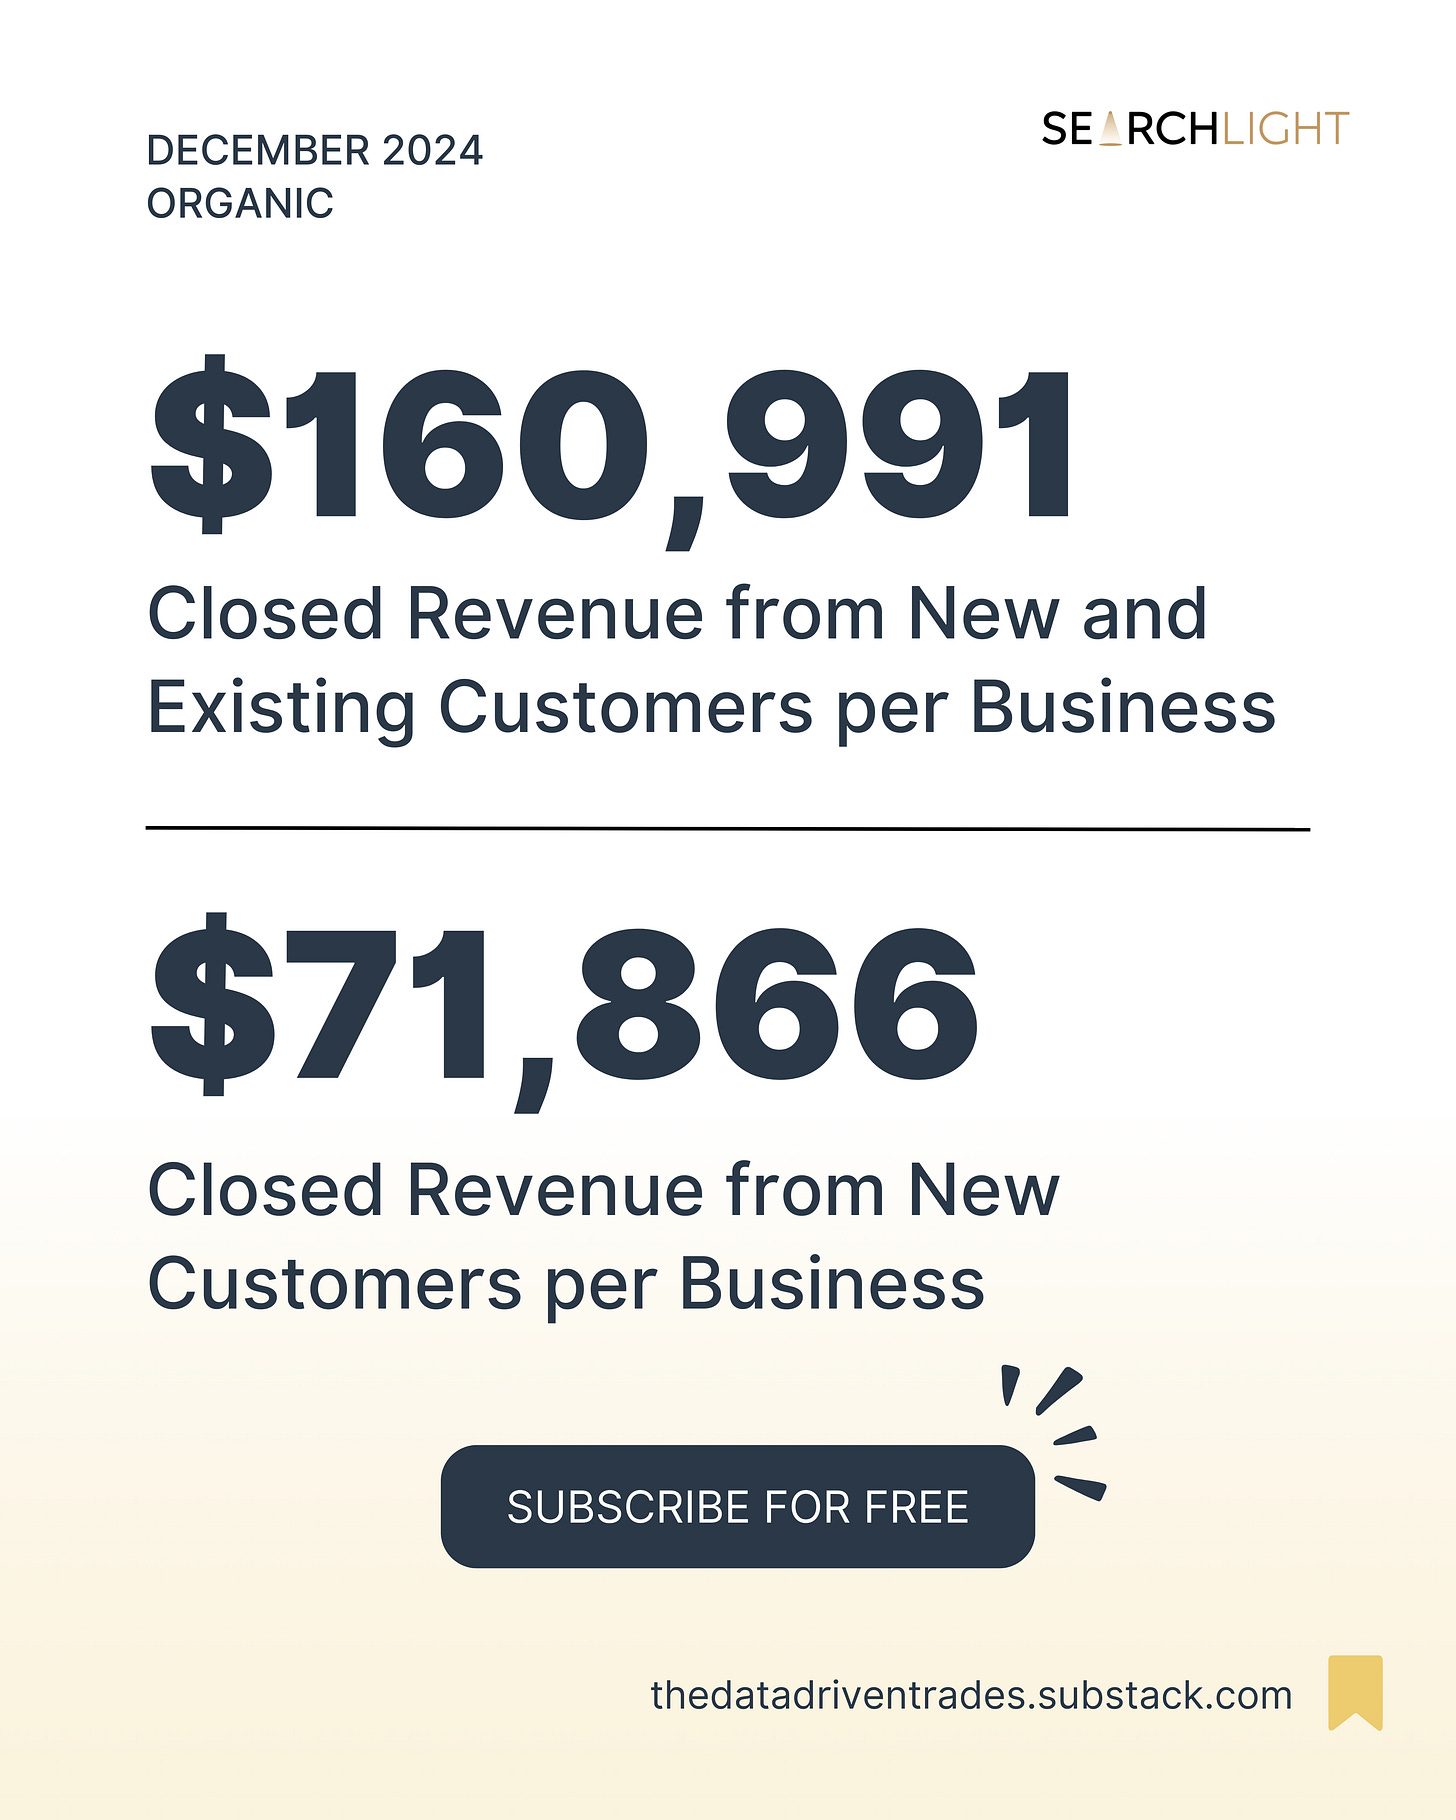
Each business in this sample earned $160,991 in closed revenue on average from organic channels (new and existing customers) and $71,866 in closed revenue from new customers only:
The ROI on the closed revenue for new and existing customers was 44.7x (up 2% month-over-month and 17% year-over-year) while the revenue potential on new and existing customers was an 86x (up 12% year-over-year).
Looking at new customers only, closed revenue was up 30% year-over-year with a 19.89x ROI (based on total spend, not just spend on new customers).
Closed revenue from new customers was also up 3% month-over-month.
It’s nice to see an increase of revenue volume month-over-month (although it was small) since we saw a down trend the past few months.
January will start with less sold revenue, but I am eager to see how 2025 starts out!
Until next time . . .
-Jon


