👋 Hey, Jon here! This week, we are exploring September’s Organic revenue performance. The organic channels in this sample include Google and Bing Organic Listings, Google Business Profile, Organic Facebook, Yelp Organic, and DuckDuckGo.
I’ll just be sharing year-over-year data versus month-over-month data for this newsletter. I’ve heard from many of you that YoY is much more important and that MoM is ‘noise’ because of seasonality. If you still want month-over-month included, please respond to this and let me know.
Before we get into the September data, I’ll summarize August’s organic performance:
For every $1 spent on Organic in August, $32.20 in closed revenue was generated, but sold revenue decreased by 13% (indicating a slower start for September):
Lead Volume: -12% MoM
Average Ticket: -8% MoM
Sold Revenue: -13% MoM
Customer Acquisition Cost: $97.59
Closed Revenue: -17% MoM (32.2x return on investment)
As usual, shout out to Josh Crouch and his team at Relentless Digital, who partnered with us to measure lead-to-revenue from their organic and LSA management services, enabling us to share these trends with you.
Note that organic spend (based on SEO management fee) decreased by 2% year-over-year.
**All data below is year-over-year only for accounts active in the same time period last year. Apples to apples!
Organic Unique Lead Volume Increased by 3% Year-over-Year
As much as I want to stick with year-over-year data only, I will add in that unique lead volume decreased 9% month-over-month, the second consecutive month with a decrease in leads (in August, unique leads dropped by nearly 13%).
However, in the spirit of smoothing out seasonality, lead volume for the contractors in this sample increased by 3% from September 2023.
Not only did unique leads increase, but so did:
Booked Customers: +14% year-over-year
Run Jobs: +7% year-over-year
Paying Customers: +3% year-over-year
Although the paying customer rate remained unchanged year-over-year (19%), the number of paying customers from Organic channels was still higher this year because active customers booked and matched net-new revenue at higher rates in September ‘24 than in September ‘23.
It Cost $79.09 to Acquire a Paying Customer From Organic Channels in September, Down 5% Year-over-Year
More paying customers from organic channels usually means a decrease in customer acquisition costs.
Spend (SEO fees) did come down 2% year-over-year, plus a 3% increase in paying customers netted out to a 5% overall decline in customer acquisition costs.
June was still the least expensive month for organic channels in 2024 (versus July in 2023), but it is nice to see CACs come back down in September.
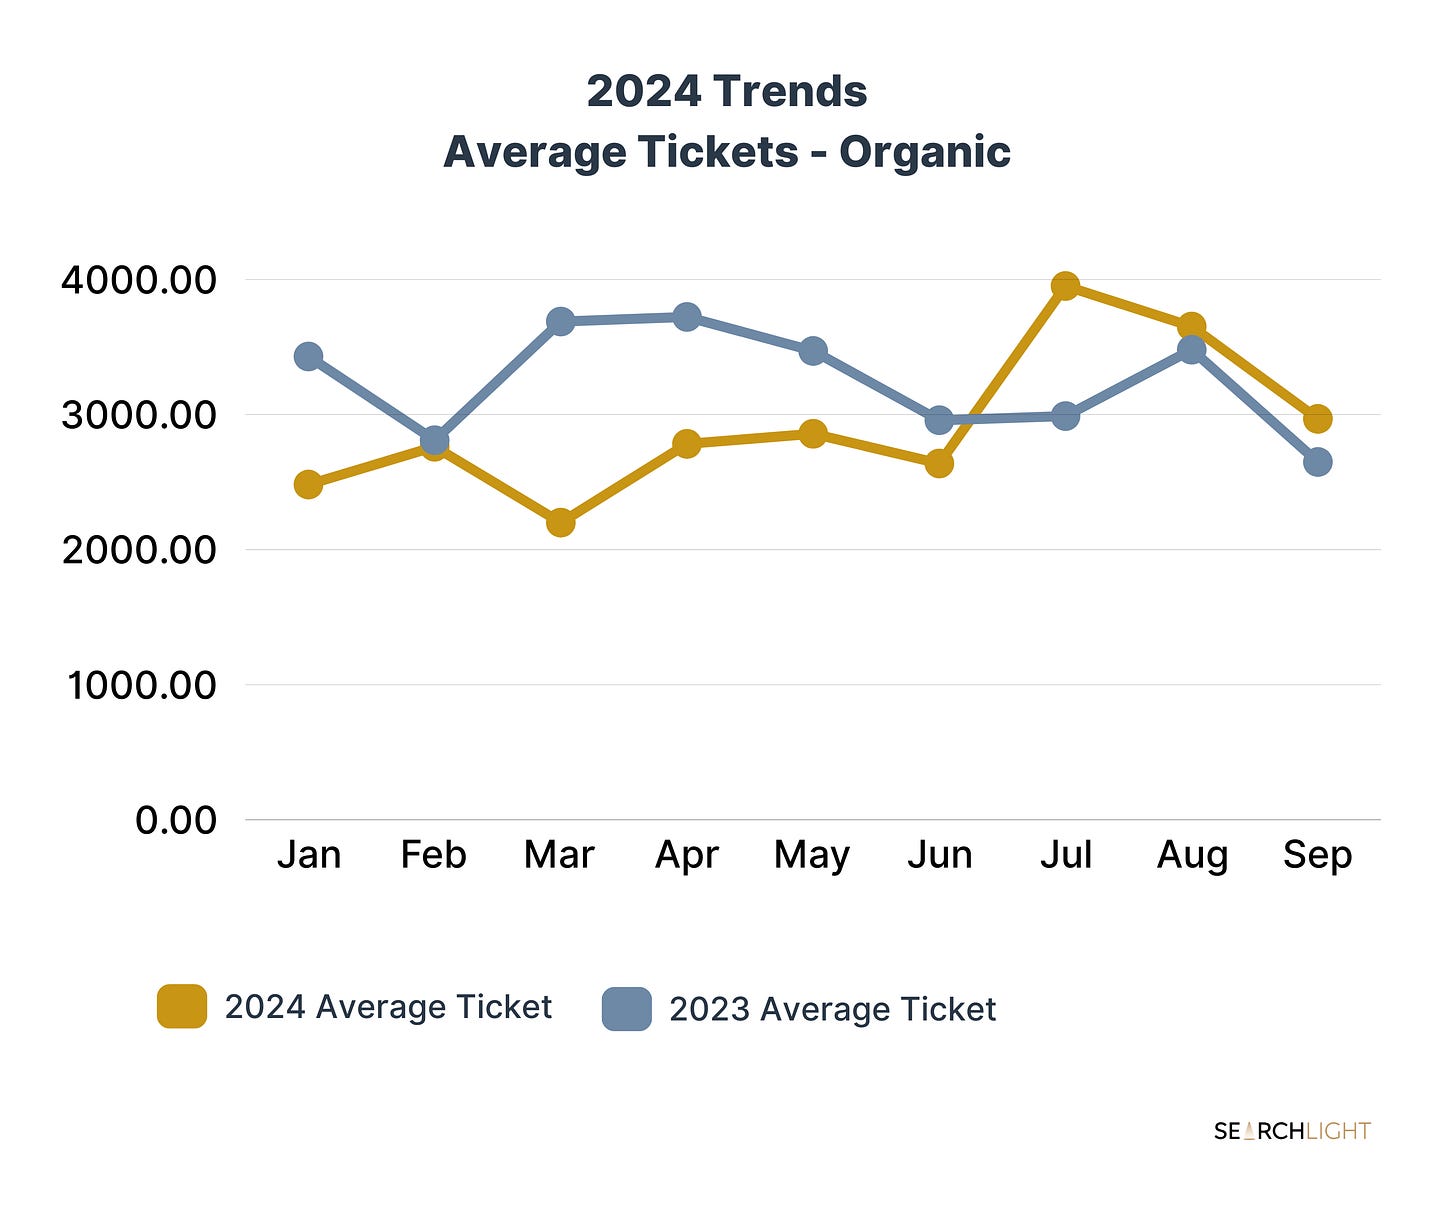
Average Tickets Increased by 12% Year-over-Year
Average tickets saw a nice year-over-year jump, with the average customer spending $319 more in September 2024 than in September 2023.
It’s been interesting to watch average tickets over 2023 and 2024 because they’re a bit all over the place with no definitive trends.
Average tickets certainly impact revenue outcomes, but based on this data, it can be hard to predict where they’ll land.
Sold Revenue from Organic Leads Decreased 11% Year-over-Year
The total revenue opportunity generated by Organic channels (the sum of estimated revenue, sold revenue, and closed revenue) was up 15% year over year.
Of that revenue opportunity, 46% was converted to closed revenue in September 2024 versus 43% in September 2023.
Even though sold revenue was down 11% year over year, sold AND closed revenue was up 15% year over year.
This means that October will start with a smaller pipeline than in 2023. Still, based on the data, it looks like the businesses in this sample were efficient at closing and completing a higher percentage of the opportunities brought in via Organic, so it’s not a “bad” thing that the pipeline is smaller.
Sold revenue is still applicable here in that October will start slower, and these businesses can plan for that and account for the slower start in their sales targets.
Closed Revenue from Organic Leads Increased by 22% Year-over-Year
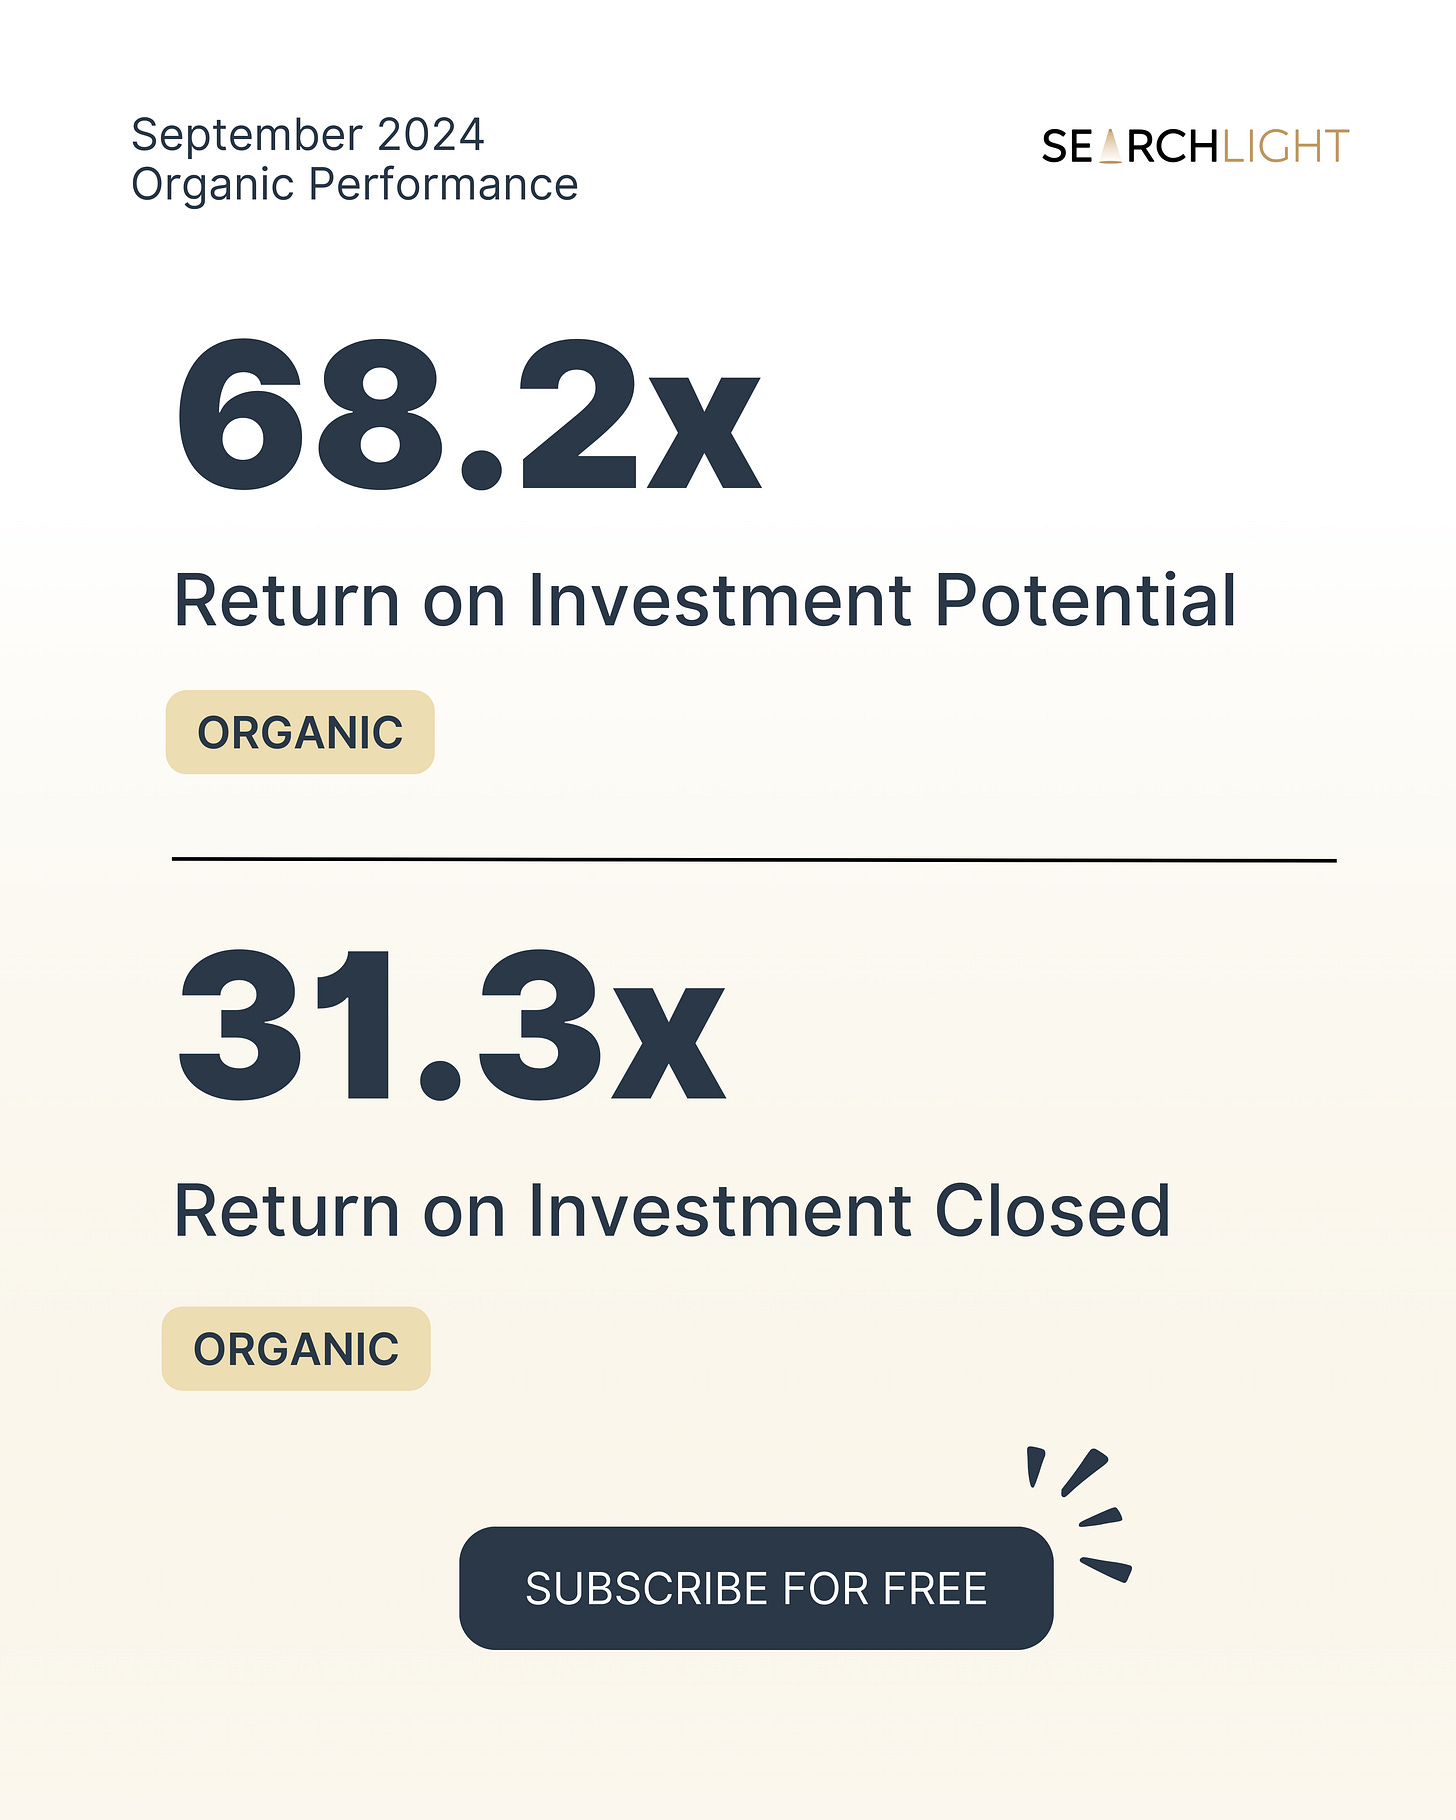
While month-over-month ROAS potential and closed came down, year-over-year closed revenue is up 22% (revenue volume), and ROAS closed is up 25% year-over-year.
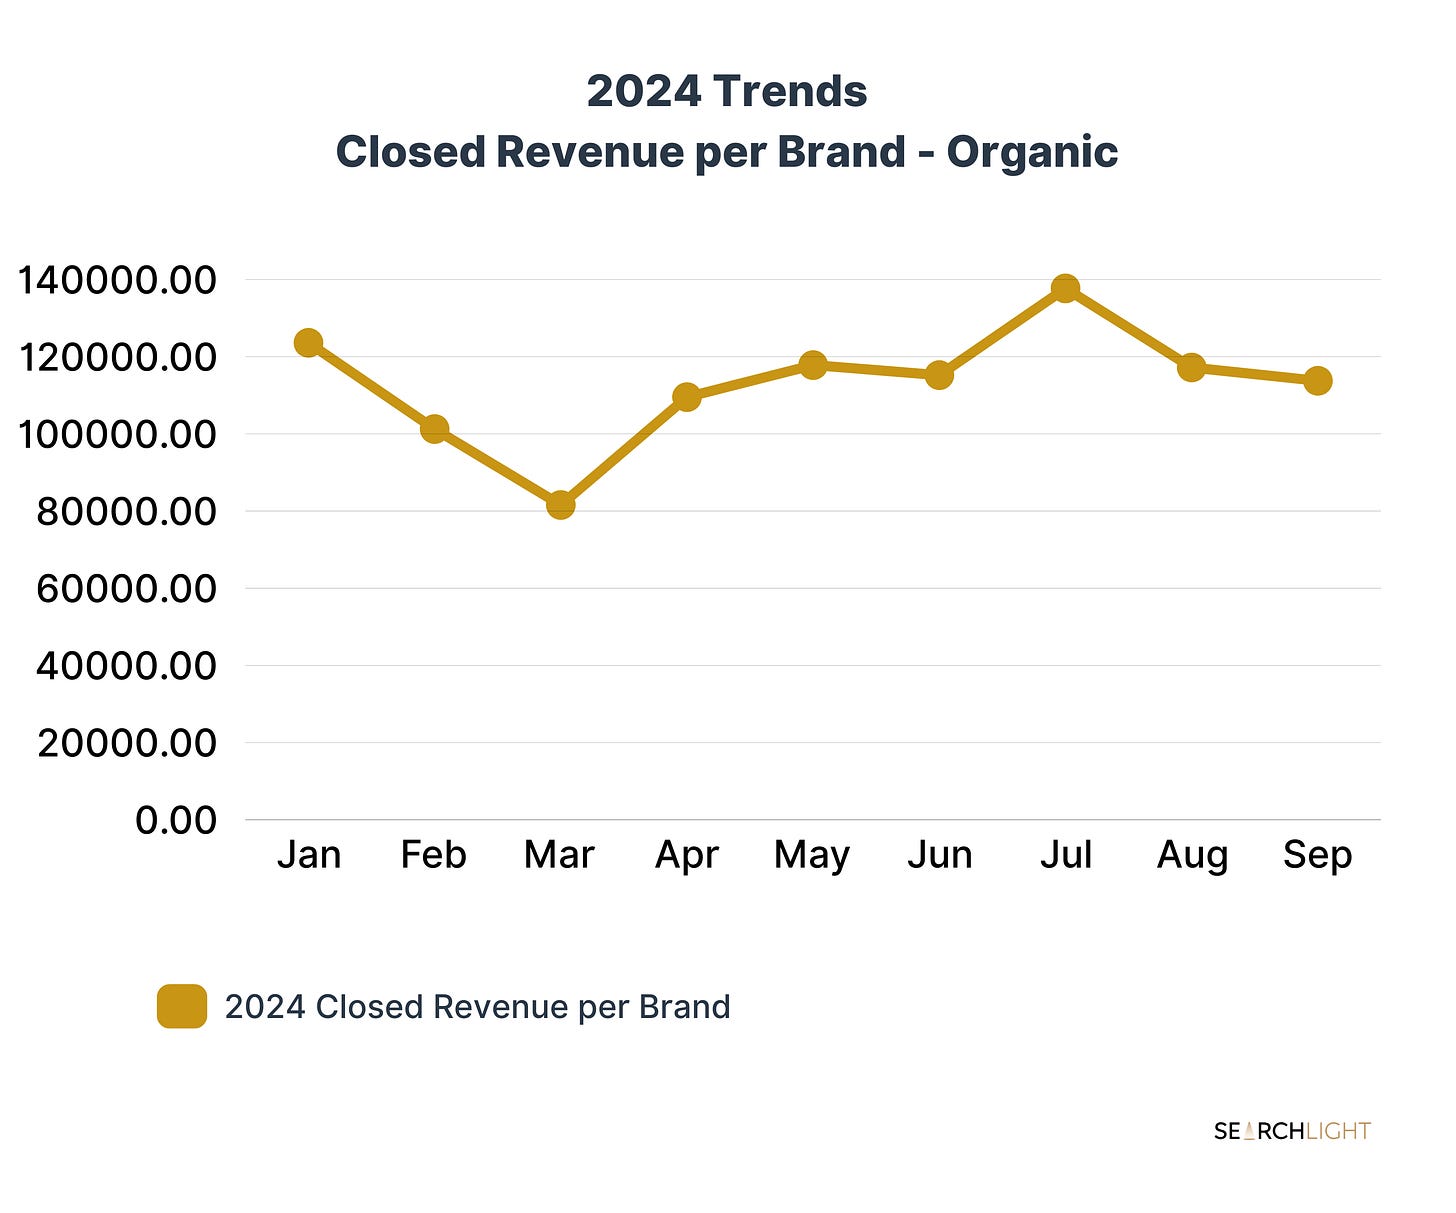
Revenue per brand from Organic channels was also up year-over-year by 22%.
On average, the brands in this sample earned nearly $21,000 more in September 2024 than in September 2023 from Organic channels.
And looking at 2024, closed revenue per brand is still at the same level it was back in June:
Overall, September was a solid month for Organic performance, with plenty of year-over-year growth.
PS - 75% of closed revenue in 2024 was converted via the Google Business Profile, compared to 87% the prior year. GBP dominated in 2023 and still is to some extent in 2024, but it’s essential to keep an eye on revenue by channel to help shift your SEO investments and priorities.
Until next time . . .
-Jon


Hey Jon! Question for you. Do you have an overall Quarterly Lead Growth % from all sources? In your posts you go over the lead growth %'s in Organic Leads and PPC Leads, but 'd imagine there are other lead gen sources than just those two, and am curious what the overall growth or decline has been in your experience compared to what my HVAC brand is experiencing. Thank you!
Quick question. How is your cost per lead determined. Are your leads defined as calls over a certain amount of minutes or any call? We just want to make sure we are comparing apples to apples when we look at our data vs industry data. Thanks in advance. Blythe.Grates@intermountainhs.com